
Your compensation review cycle closes, but two senior engineers resign within a week because a competitor mapped your salary bands with greater precision. Your CFO freezes merit budgets mid-cycle after discovering payroll run-rate overshot the annual plan by 8%. These moments expose the gap between recording headcount and actively modeling its cost. Annual spreadsheets cannot reconcile real-time attrition, equity dilution, and skills inflation.
Total US employment is projected to grow just 3.1% between 2024 and 2034, tightening the market for scarce talent while 63% of employers already cite skills gaps as the key barrier to business transformation. Generic HCM platforms track employee records, compliance workflows, and payroll data, but they stop where total rewards strategy begins: scenario modeling compensation costs, benefits weighting, attrition shock analysis, and multi-year skills budgeting.
Specialized workforce planning software like Anaplan, Visier, and Workday Adaptive Planning operationalizes the three-dimensional model of headcount, compensation, and skills over time horizons a standard HRIS cannot touch. This guide maps the eight-step framework total rewards teams need to select, implement, and monetize these tools in 2026.
A specialized planning tool moves compensation strategy from annual record-keeping to continuous, data-driven scenario modeling.
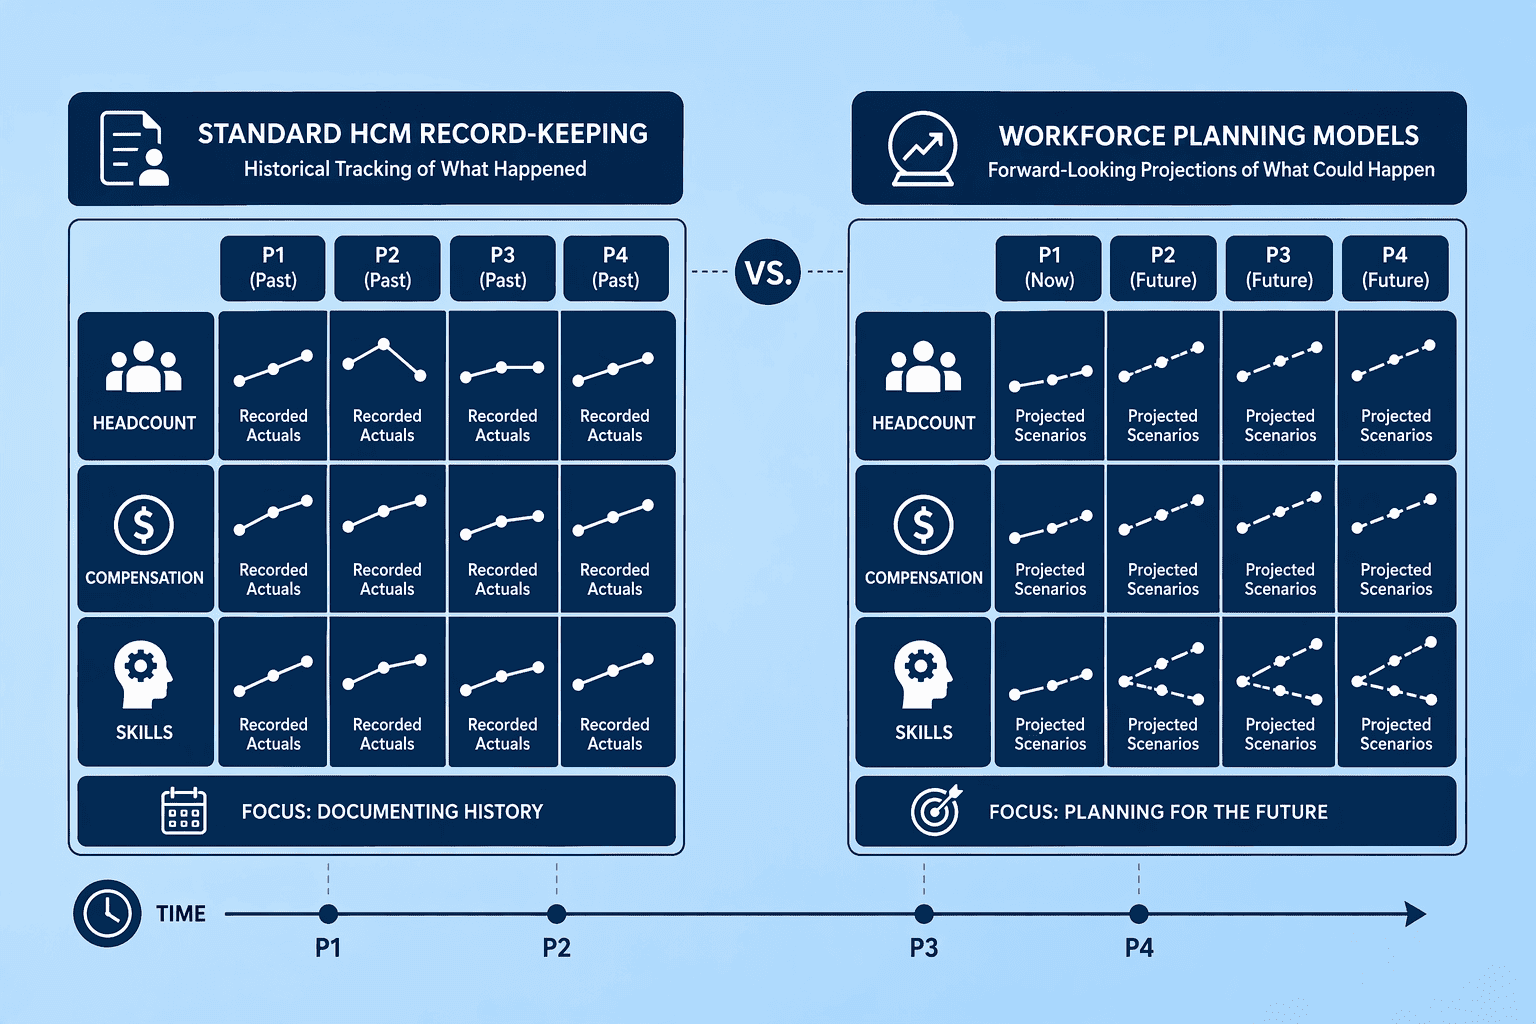
Traditional HCM modules record a transaction. Workforce planning software models its downstream cost. The distinction sits in the projection architecture.
| Dimension | Standard HCM (Record-Keeping) | Specialized Workforce Planning (Modeling) |
|---|---|---|
| Headcount data | Current FTE count by department, snapshots only | Multi-period headcount projections with driver-based hiring, transfer, and retention assumptions |
| Compensation cost | Payroll journal with actuals, static salary fields | Scenario-tested forecasts of base, variable, equity, and benefits spend at the role, location, or business-unit grain |
| Skills inventory | Self-reported or manager-entered tags, rarely time-stamped | Trended skills supply-and-demand curves that feed gap analysis, build-versus-buy decisions, and bench-strength scoring |
| Time horizon | Month-end closing view | Rolling 12-to-36-month projections refreshed quarterly, with what-if branching |
| Analytical capability | Standard reports and dashboards showing past data | Driver-based simulation engine that projects compensation costs under different growth, attrition, and promotion scenarios |
Workday Workforce Planning software enables users to model hiring, transfers, and retention plans using driver-based assumptions and see cost impacts instantly. This driver-based logic treats compensation, headcount, and skills as linked variables a total rewards team can stress-test before budget sign-off. It is a different architecture from an HRIS module, built for forward modeling rather than backward reporting.
A generic headcount planning module will frustrate a compensation team within one budget cycle. The tools that earn their place map directly to the total rewards workflow: analyze current-state pay, model changes, project cost, and issue personalized communications.
Look next for scenario engines that let you instantiate competing budget versions (2.5% vs 3.5% merit, with and without a targeted retention pool) side by side, and total-rewards dashboards that collapse cash, equity, and benefits cost into a single employee-level view. This feature set is what separates a modeling platform from a data warehouse.
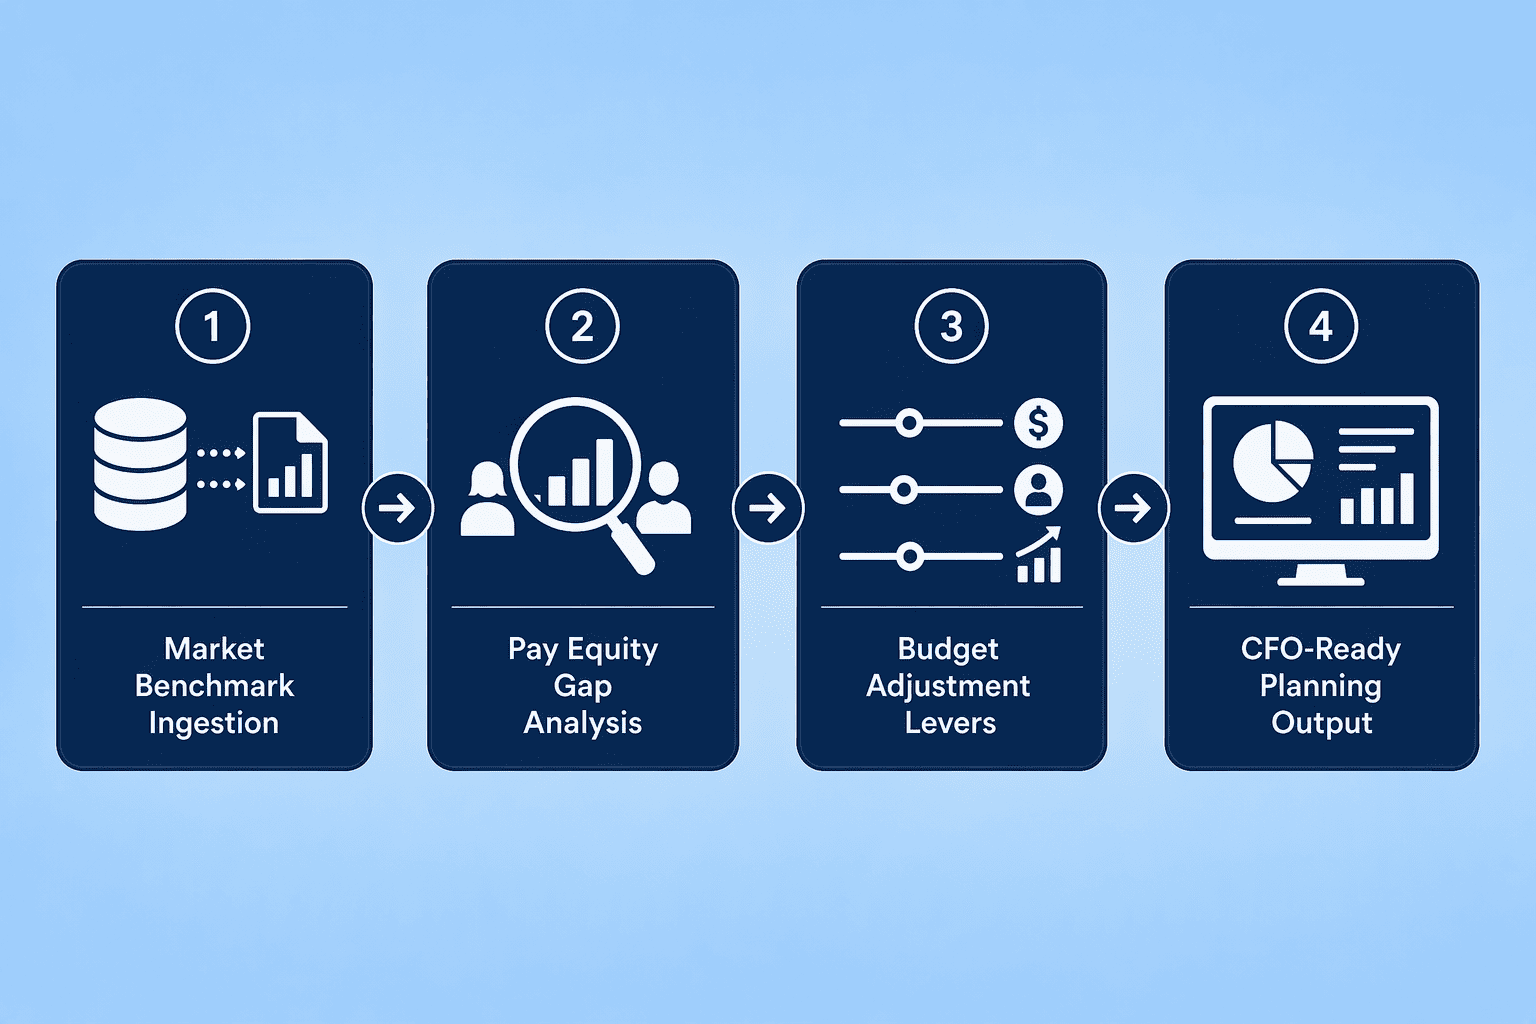
The most valuable planning software turns pay equity and market competitiveness into adjustable budget levers. It lets you model the exact cost of closing gaps before you present next year's numbers to the CFO. Here is the operational sequence:
The 2026 market bifurcates cleanly. Platforms that grew out of financial planning (Anaplan, Workday Adaptive Planning) offer superior driver-based cost modeling, rigged for FP&A integration. Tools born from people analytics (Visier, ChartHop) supply richer workforce insight, org visualization, and skills-trend analysis.
SAP SuccessFactors sits in a category of its own for organizations already embedded in the SAP ecosystem. Its workforce planning module connects directly to SAP's talent, learning, and payroll modules, enabling a skills-driven planning flow where learning-investment decisions feed role-readiness projections and succession plans.
For total rewards teams, the choice reduces to a strategic fork. Select Anaplan or Workday Adaptive Planning when the dominant use case is multi-entity, multi-currency compensation cost modeling that must synchronize with the corporate financial plan. The value lies in never reconciling headcount costs between the HR budget and the general ledger. Choose Visier or ChartHop when the primary need is deep workforce analytics: attrition forecasting, diversity pipeline analysis, span-of-control costing, and skills-gap quantification. An organization at only 21% maturity in workforce planning likely starts with analytics to build capability before graduating to integrated financial modeling.
Midsize and high-growth companies should also evaluate the specialist compensation-platform category. Tools like CompUp combine compensation planning, pay equity analytics, and total rewards statement generation on a purpose-built platform that integrates with BambooHR, Lattice, Darwinbox, and Workable. Pave further demonstrates the integration-depth standard, with connections to 10+ HRIS platforms including BambooHR, Gusto, Rippling, TriNet, and Workday. For teams that need compensation modeling without deploying an enterprise-scale planning suite, these focused tools fill the gap. Also note that Dayforce acquired Agentnoon in October 2025, consolidating the vendor landscape; if Agentnoon was on your shortlist, evaluate its Dayforce-integrated successor instead.
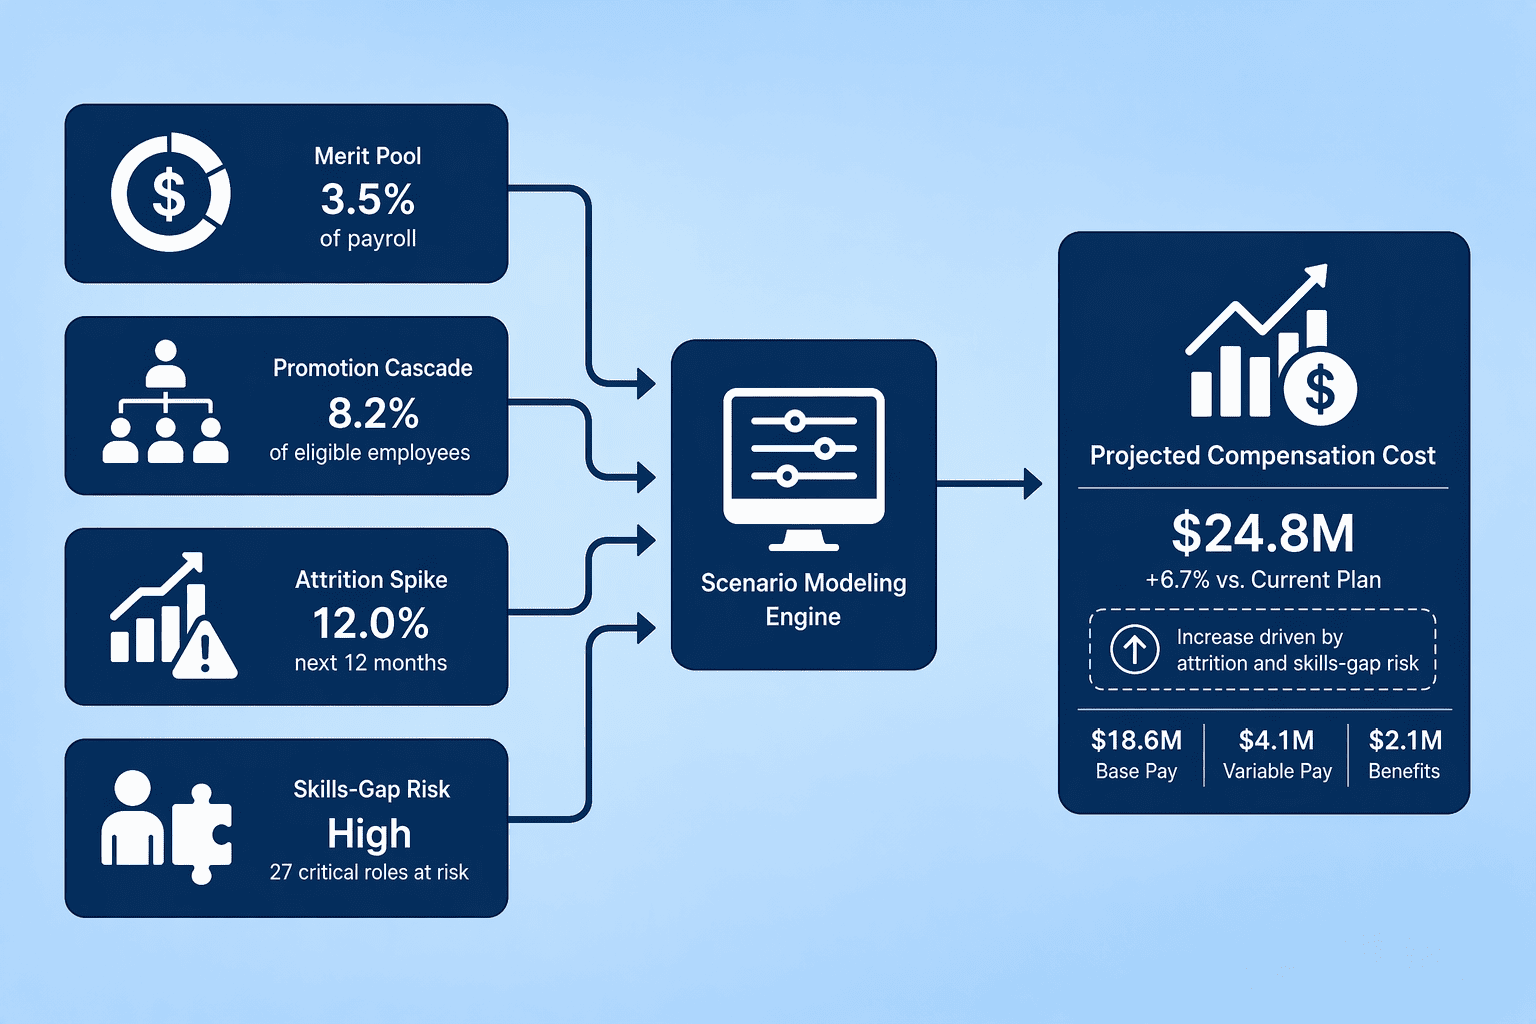
Static budgets break the moment a key hire resigns or a market benchmark jumps. Scenario modeling turns those breaks into contingencies you price before they hit. Five scenarios worth running right now:
Compensation modeling that connects directly to workforce data gets you past the annual spreadsheet scramble. Real-time HRIS sync means the comp review cycle draws on live headcount and salary data. What used to take weeks of cross-functional reconciliation turns into a repeatable process. And transparency matters: when managers see how merit pools and equity guidelines apply consistently, pay-equity gaps shrink on their own.
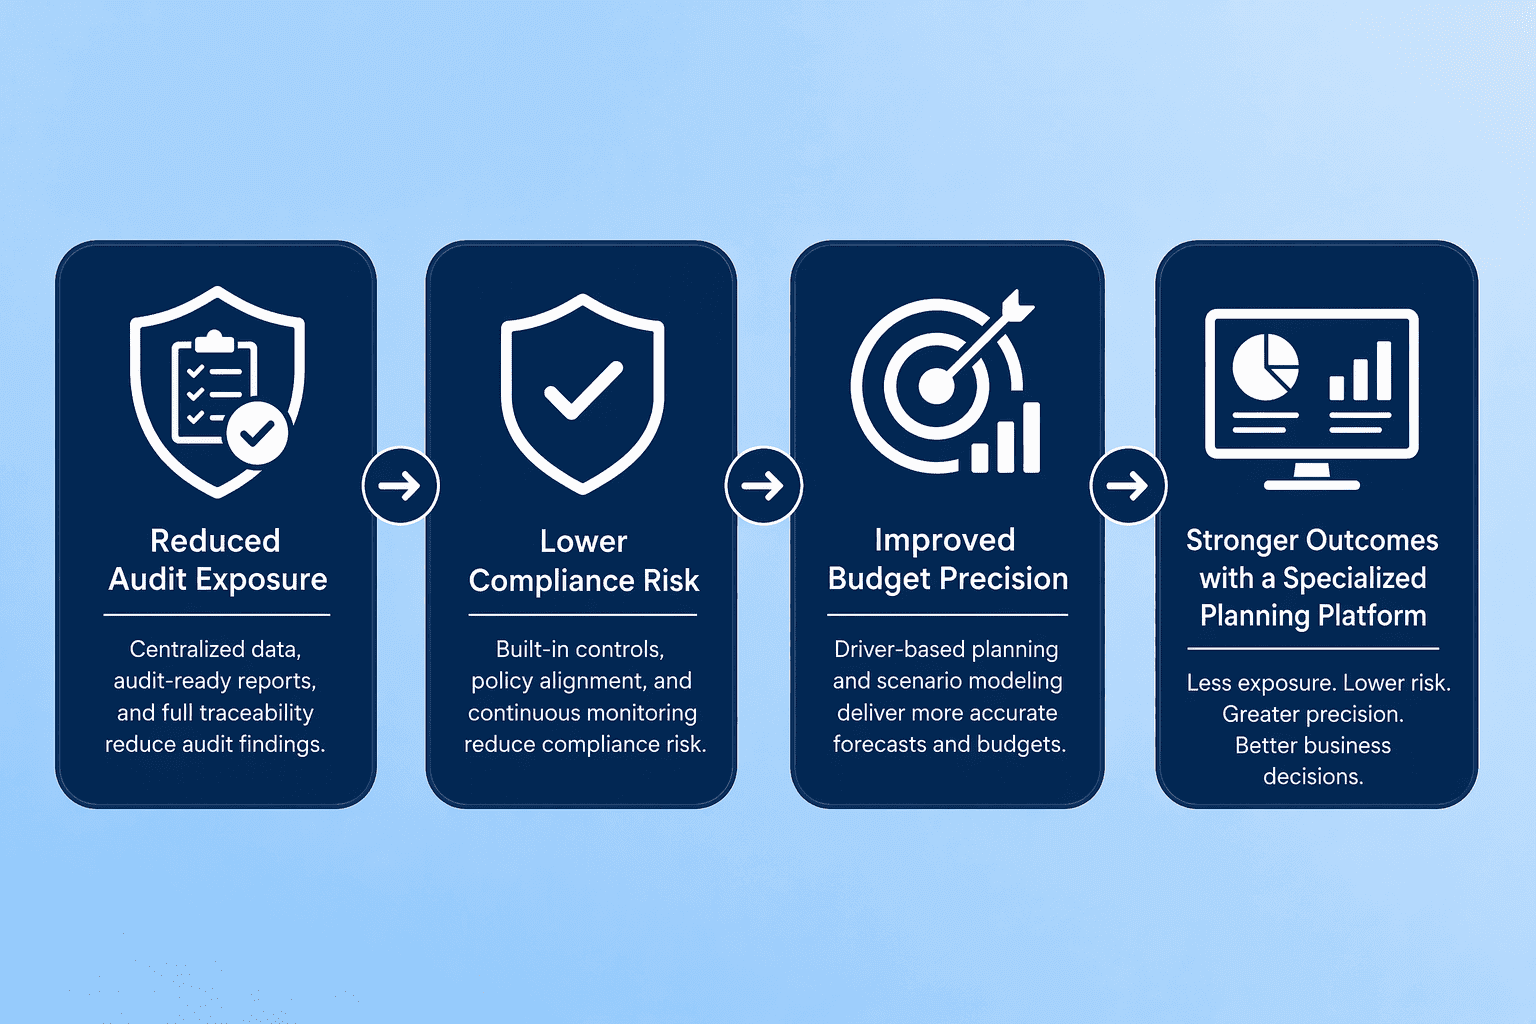
Finance committees approve tools that avoid cost, not ones that promise insight. Your business case must price the risks a specialized platform neutralizes.
A workforce planning model is only as credible as its source data. If the employee count in the plan diverges from the one in the payroll register, every compensation scenario you build sits on a broken foundation.
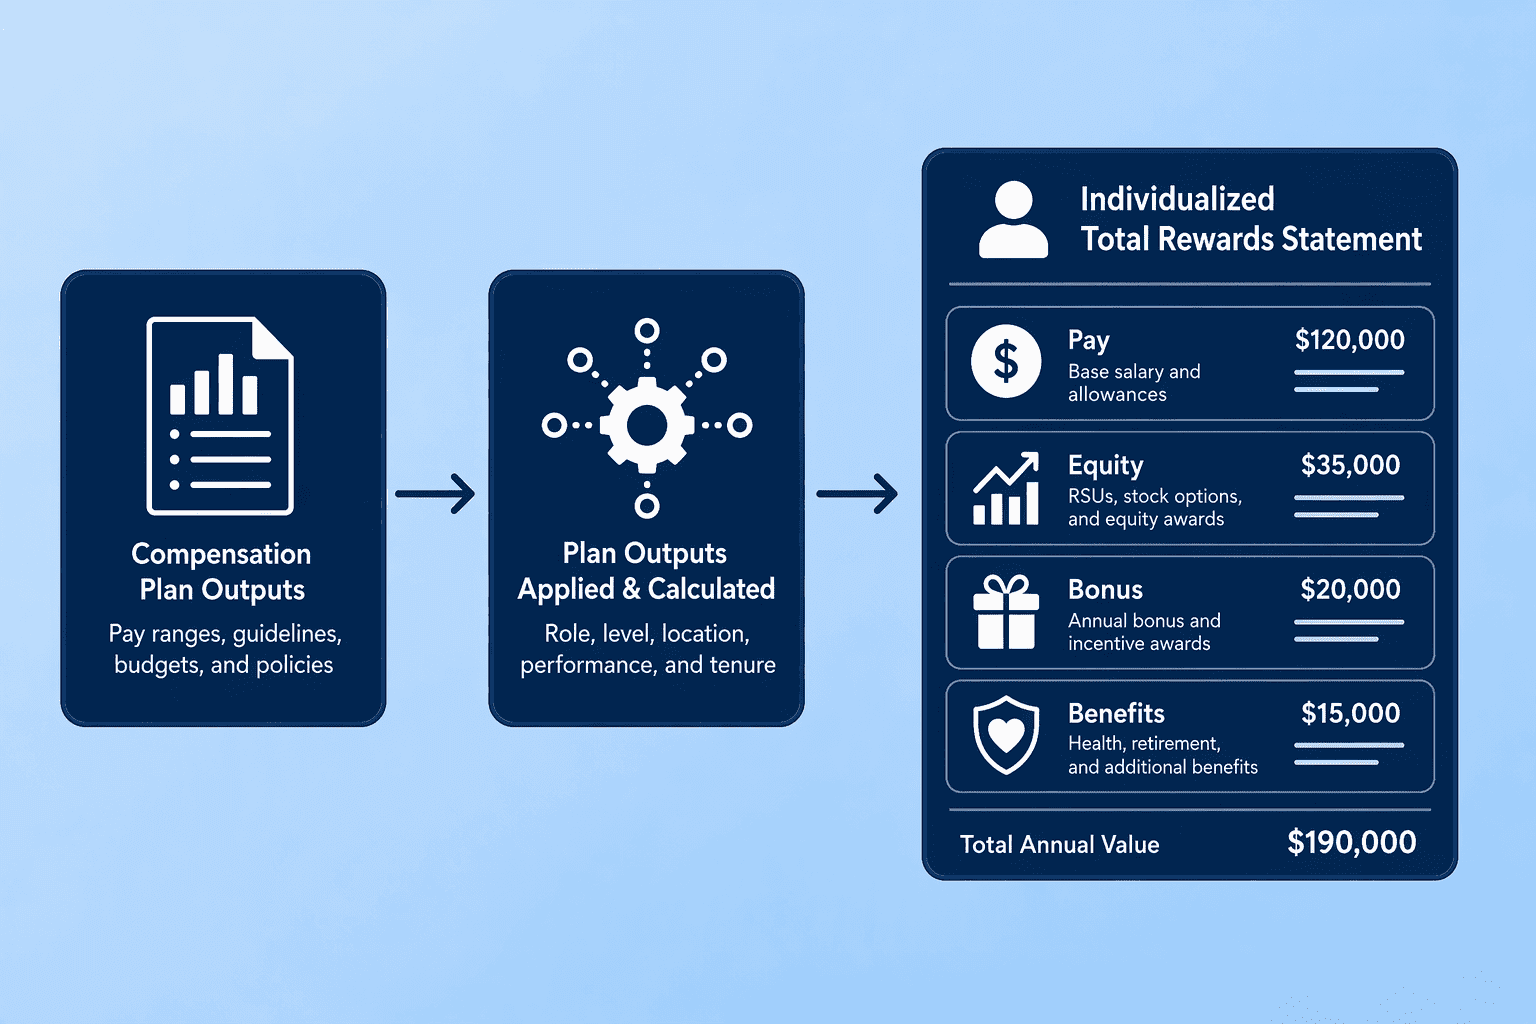
Every planning output eventually becomes an employee conversation. The technology chain breaks if the compensation change you modeled does not reach the employee in a personalized, comprehensible format.
Total rewards statements bridge this gap. A platform that ingests the planning model's outputs, merit increases, equity grants, bonus allocations, benefits cost, can auto-generate individualized statements showing each employee the full value of their compensation package. BambooHR Total Rewards automatically generates compensation statements from people data already in the system, eliminating double entry and errors. This automation replaces the manual variable-compensation work most teams still patch together post-cycle, cutting statement-generation time from days to minutes while eliminating reconciliation errors.
Look for personalization mechanics that go beyond name and salary swap. Effective statements display equity projections showing current and predicted value, highlight benefits costs the employer pays invisibly, and contextualize the individual's pay relative to market benchmarks. BambooHR Total Rewards includes equity projections that show current and predicted value of equity offerings and provides real-time self-service access so staff can view their own compensation statements. When employees see the $14.01 in hourly benefits cost alongside their $32.60 wage, the perceived value of the total package rises without a single comp change.
Purpose-built compensation platforms like CompUp bake this communication layer directly into the planning workflow. The tool can automatically generate personalised Total Rewards Statements at the close of the appraisal cycle, ensuring the merit increase, equity grant, and variable pay decisions finalized in the planning module flow straight into the employee-facing document with no offline data transfer. The output closes the loop from strategic modeling to employee perception, which is where the ROI on compensation spend ultimately materializes.
Total rewards leadership in 2026 demands a technology stack that models compensation costs, skills investments, and equity risk as a single system. The eight steps here move from foundational definitions through platform selection, scenario modeling, business-case construction, integration architecture, and employee-facing communication.
Organizations that switch from static annual compensation cycles to continuous, data-driven planning gain measurable precision on their largest operating expense. They also reduce pay equity and turnover risk in ways you can quantify.
The next move is to see a platform in action. Book a CompUp demo to evaluate how its compensation management, pay equity analytics, and total rewards statement generation map to your specific planning workflow. A good next step is seeing how CompUp puts this into practice.
Workforce planning software models headcount, compensation costs, and skills inventory across future time horizons using driver-based assumptions. General HCM platforms record employee transactions and past data. The planning tool projects compensation spend under different scenarios, which an HRIS cannot do.
Prioritize compensation scenario modeling with driver-based logic, pay equity analytics that flag and cost remediation, skills-based budgeting, a what-if engine for competing budget versions, and integrated total rewards dashboards that display cash, equity, and benefits per employee.
It ingests market benchmarks, runs regression analysis to detect pay gaps, models the cost of closing those gaps, and integrates the remediation line into the full compensation budget. This connects equity diagnosis directly to budget allocation decisions.
Anaplan and Workday Adaptive Planning excel at finance-connected cost modeling. Visier and ChartHop lead in people analytics. SAP SuccessFactors offers integrated skills-driven planning. Specialist tools like CompUp and Pave serve compensation-focused teams needing planning plus communication.
Quantify the hard-dollar risk reduction: pay equity audit-cost avoidance, budget overrun prevention tied to hourly compensation spend, and turnover-cost savings from attrition-risk modeling. Frame the tool as a financial control that prevents recurring six-figure liabilities.
Bidirectional integration with Workday or SAP SuccessFactors for employee master data and compensation history. A direct payroll feed to validate projections against actuals. Pre-built connectors to talent and learning platforms for skills-based planning scenarios.
Community Manager (Marketing)
As a Community Manager, I’m passionate about fostering collaboration and knowledge sharing among professionals in compensation management and total rewards. I develop engaging content that simplifies complex topics, empowering others to excel and aim to drive collective growth through insight and connection.
Revolutionizing Pay Strategies: Don't Miss Our Latest Blogs on Compensation Benchmarking