
Your quarterly board deck shows compensation costs running 8% over plan, but that data is already six weeks old. You check with Finance and discover the variance ballooned two months ago when a critical backfill was approved outside the normal cycle. The lag between a compensation decision and its appearance in a static budget report is the single biggest threat to workforce financial control.
Moving from a retrospective annual budget review to a dynamic, always-on monitoring model has become a baseline operational requirement. Compensation cycles have accelerated. Continuous planning, a methodology embedded in adaptive platforms like Workday and real-time spend trackers from Spendesk, is rapidly replacing the rigid fiscal-year construct. Real-time compensation tracking means monitoring salary, bonus, and equity spend against approved budgets with data that updates as transactions occur, rather than waiting for month-end reconciliations to land.
This guide walks through a practical methodology for building that capability. You will define the operational metrics, map the data sources, standardize the critical formulas, and design the dashboard interface that surfaces risks long before they become irreversible overruns. The focus is on the structural setup and daily workflow, not a theoretical promise of perfect data.
Financial control over compensation demands a clear architecture linking real-time data to decision-making. Here are the non-negotiable components of a successful tracking system:
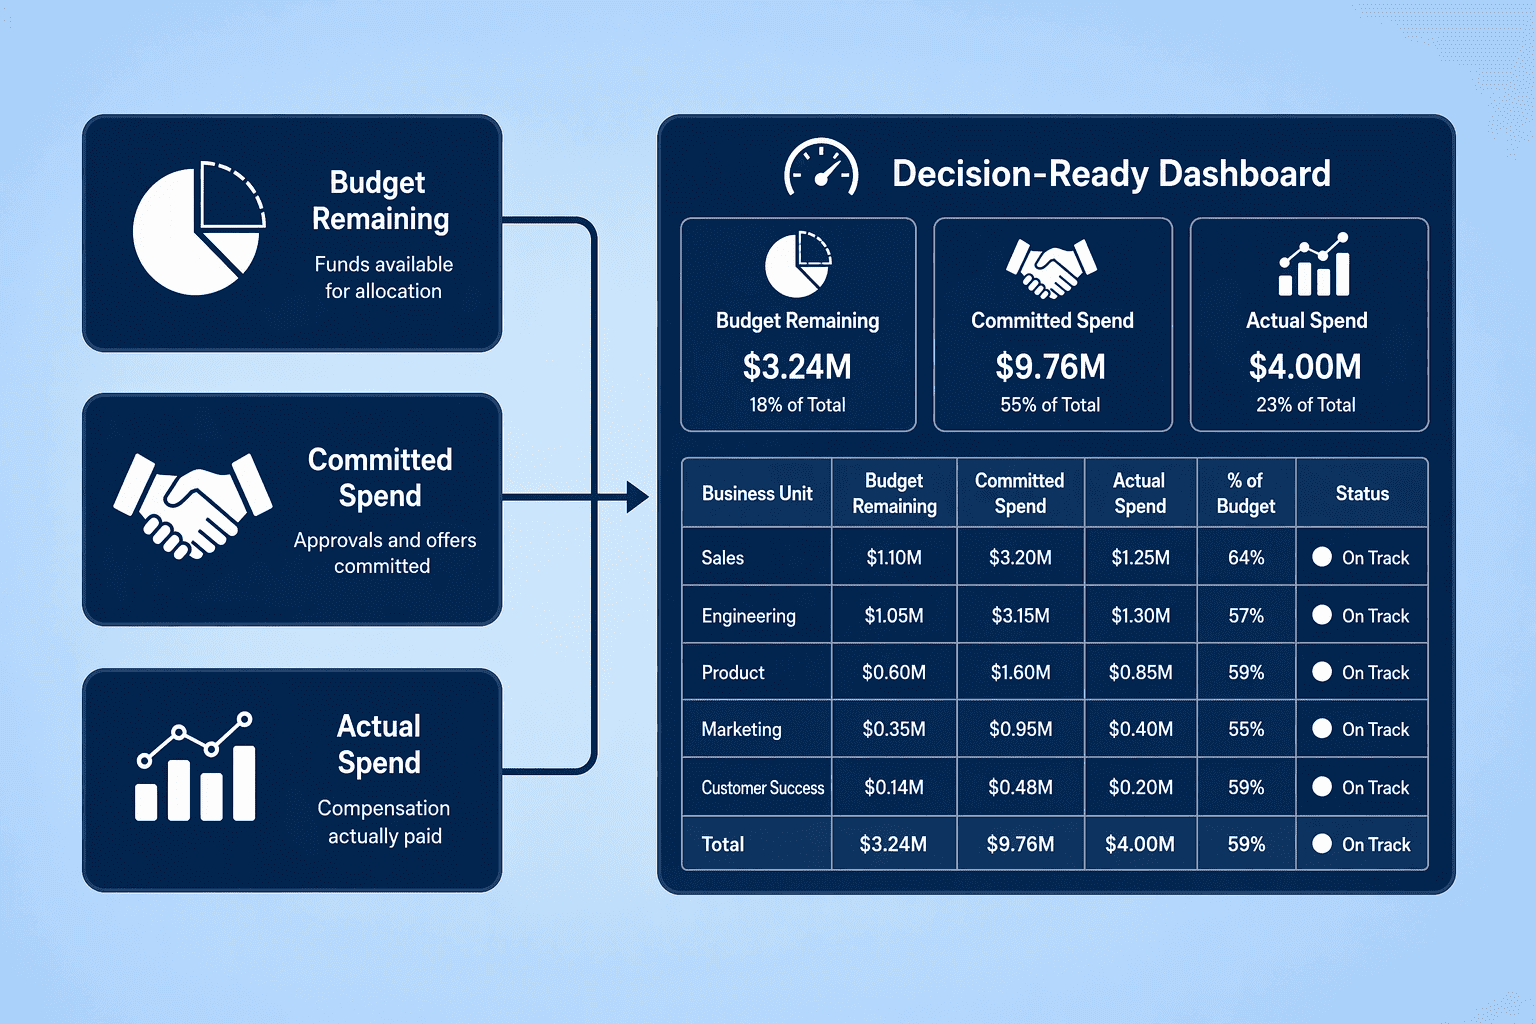
Before connecting a single API, the entire leadership team must agree on a concrete operational definition of the data they expect to see. Compensation data sits in different states, and conflating them is what causes Finance to reject HR’s numbers. The table below distinguishes the status of a dollar in your budget so your dashboard maps directly to the decisions you need to make.
| Data Type | Definition in Cycle | Update Frequency | Decision It Enables |
|---|---|---|---|
| Budget Remaining | Original budget minus actual spend and committed costs; reflects the unallocated pool still available for new offers or adjustments. | Real-time (instant upon calculation) | Determines if you can afford an additional backfill or an out-of-cycle promotion. |
| Committed Costs | Approved but unpaid allocations: signed offer letters with future start dates, approved merit increases awaiting the next payroll run, or board-approved option grants not yet vested. | Near-real-time (upon offer acceptance or approval trigger) | Shows the true drawdown of budget that will hit the P&L, preventing double-spending an allocation that is already spoken for. |
| Actual Spend | Cash that has left the business: payroll runs processed, bonus payments disbursed, and reimbursements settled. | Nightly (aligned to HRIS sync) | Validates the forecast and provides the baseline for financial close; this is the auditable trail your controller trusts. |
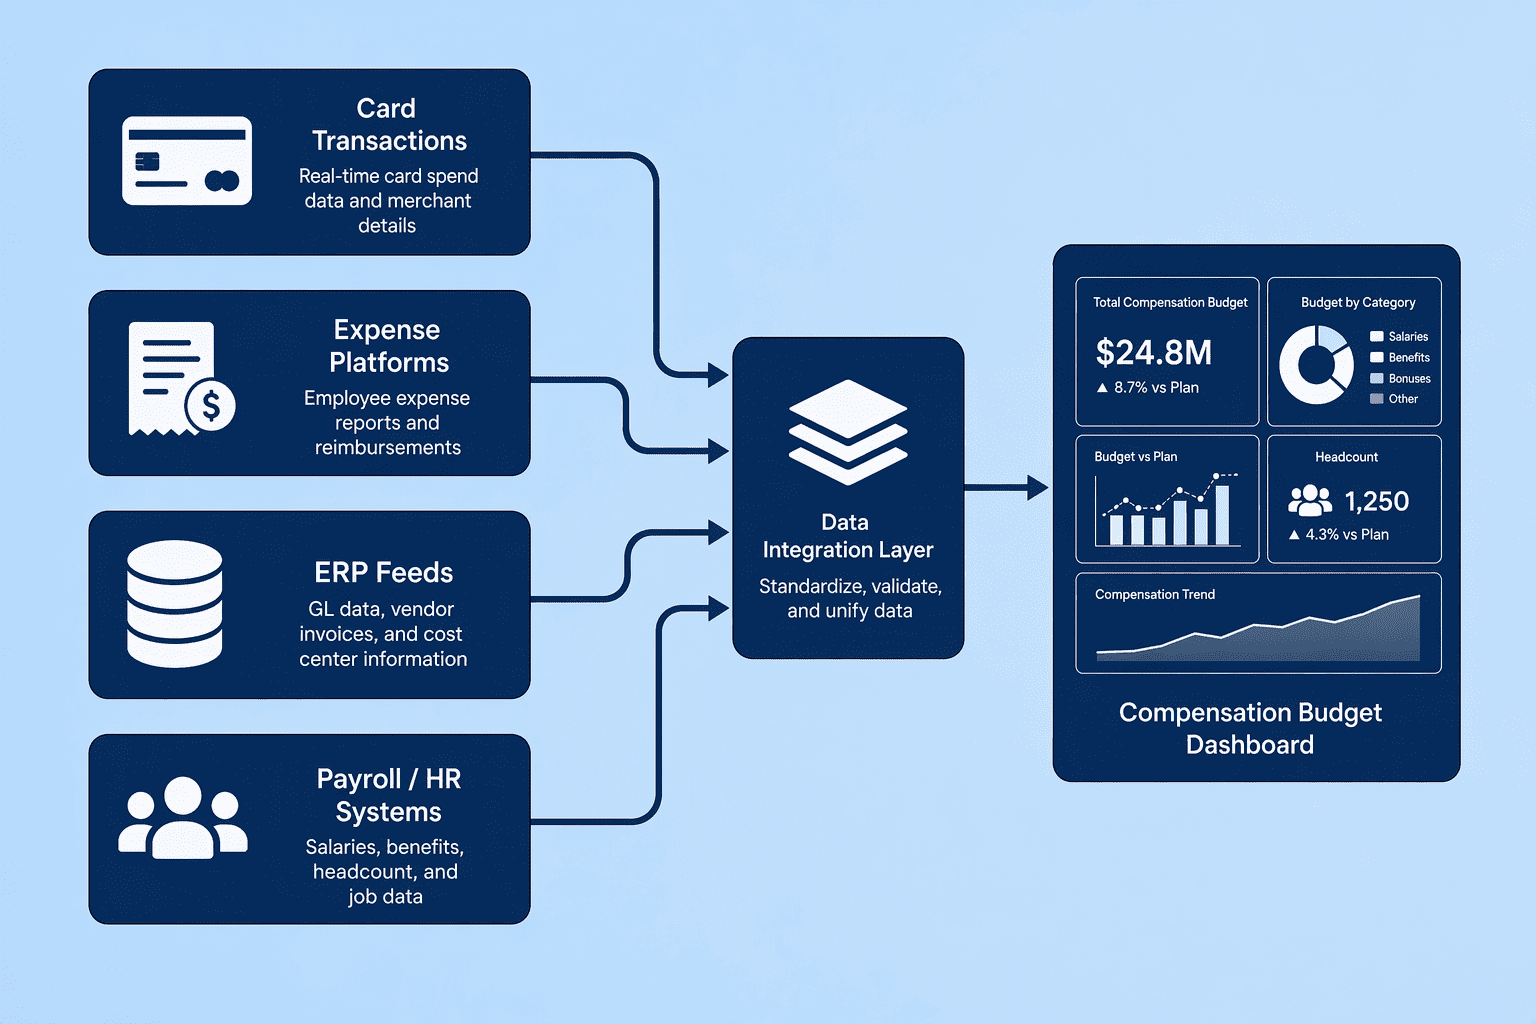
The most common failure in building a compensation dashboard is treating all data sources as equal. Hoping for a pristine, smooth integration where every system pushes instant updates is a fantasy. Building a practical hierarchy of data freshness prevents the garbage-in, garbage-out dilemma.
Start with the sources that reflect money moving fastest. Real-time card transactions, expense management platforms, and ERP core feeds show actual cash outflows first. These systems light up instantaneously when a transaction occurs.
You layer in HRIS payroll registers and benefits provider extracts next, accepting that these typically sync on a nightly cadence. The monthly accounting reconciliation, the audited general ledger file, is treated as a trailing validation layer, not as your primary dashboard driver. Placing this lagging source into a live dashboard creates phantom variances that waste hours of investigation.
For connection methods, a modern compensation platform like CompUp can ingest data via flat-file uploads and direct integration with tools like BambooHR and Lattice, pulling in salary band adherence and cycle progress directly into spend tracking (see our deep dive at 8 Best All-in-One Platforms for Workforce and Compensation Planning in 2026). For custom builds, prioritize a direct API connection to your payroll system and card provider, then build a staging table that holds the ERP's nightly export. This architecture acknowledges that lag is a constraint to be managed with data engineering, not a failure to be eliminated by magical software.
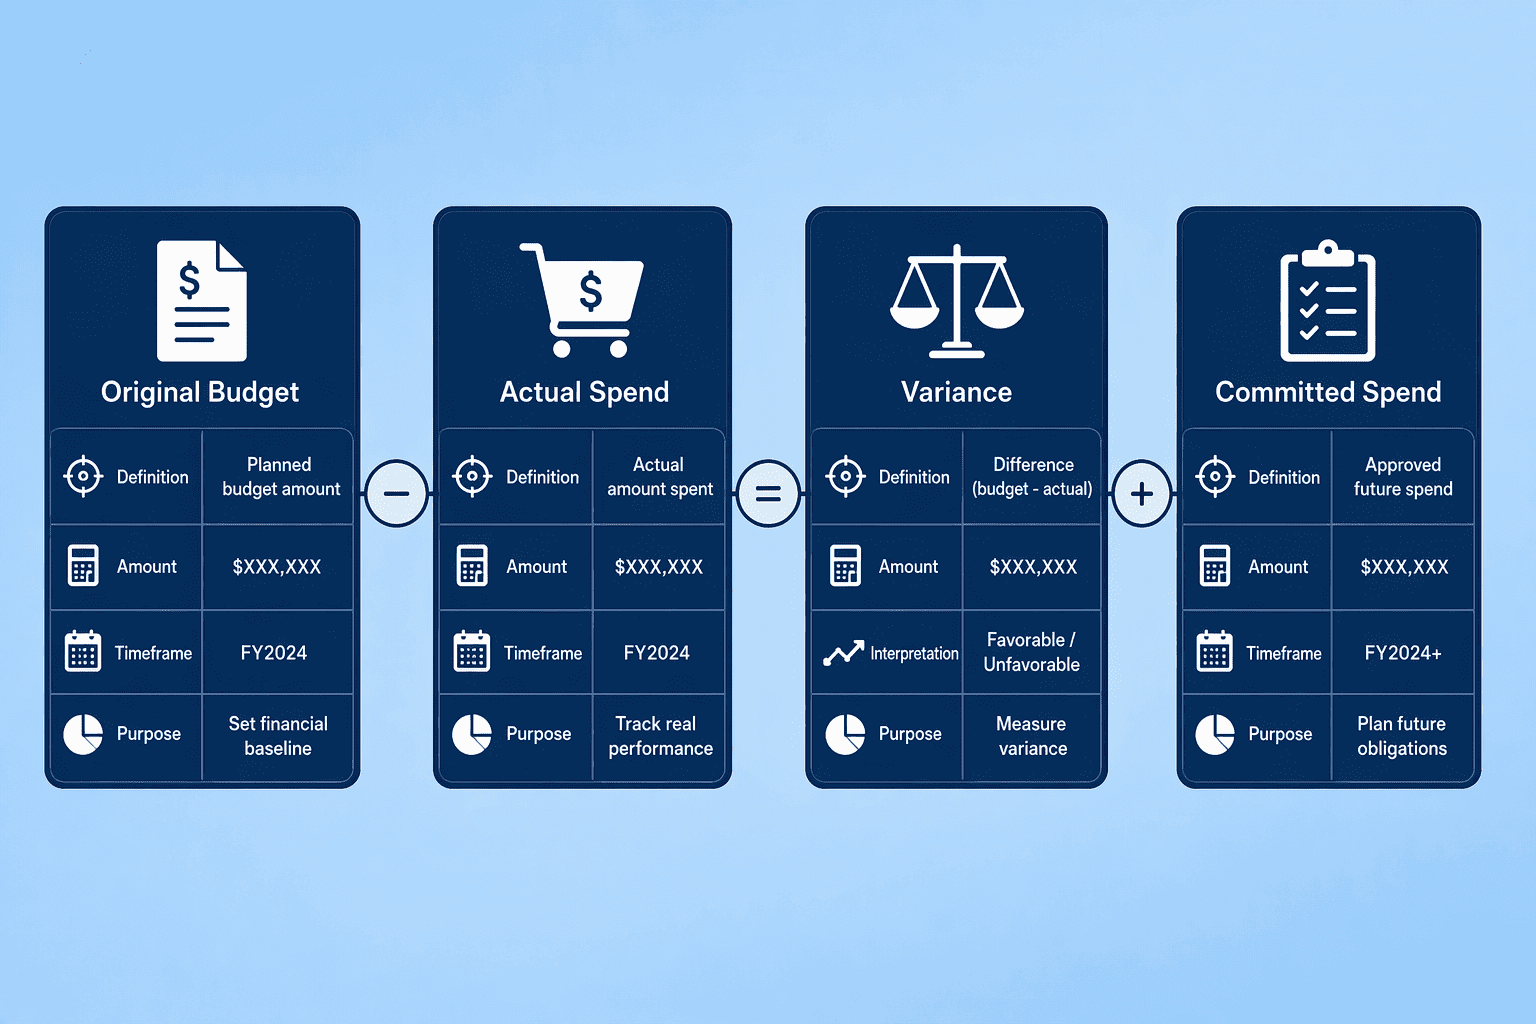
A dashboard that shows different numbers than what Finance presents in the monthly close loses all credibility by week two. You lock in trust by publishing the exact formulas upfront. These metrics, drawn from standard managerial accounting and implemented in systems like ServiceTitan, must be anchored as columns in your primary Budget vs Actual table.
Your Original Budget is the figure the board or compensation committee approved. Change Orders reflect any formally approved adjustments to that baseline, such as new headcount approvals or restructured commissions. Variance is Actual Spend minus the Budget amount.
A positive figure signals an overspend; a negative figure indicates you are under plan. Do not stop at simple variance. The % of Budget Used drives urgency: Actual divided by Budget.
The Balance to Finish is your Total Budget minus Projected costs (Committed Costs plus Actual Spend). A negative figure, usually rendered in red, signals you are functionally out of money even if the cash has not all left the bank yet.
The single most powerful forward-looking metric is the Forecasted Cost at Complete (FCAC). It projects the total final spend based on the current burn rate plus known commitments, letting you calculate the Over/Under Cost by subtracting FCAC from the Total Budget.
The interface that surfaces all this engineering should feel boringly obvious to read.
A dedicated compensation planning environment gets this right because it understands compensation logic out of the box. Generic BI tools force you to teach them what a salary band means or how merit matrices interact before they can show you anything useful. Tools such as Decusoft's seven-step framework prioritize configurability around salary structures and merit matrices.
CompUp's unified offering focuses on streamlining pay raise calculation and surfacing that data in automatically generated Total Rewards Statements at cycle close. The core component of any interface is the Budget vs Actual table. This table updates in real-time as actuals are generated within the system.
Every manager sees their allocated pool, what they've spent, and the gap between the two the moment a change lands. That live gap is a decision signal you act on immediately, not a data artifact that waits for a weekly report. Make the numbers plain.
A budget variance shown as a dollar amount and a percentage is enough. You do not need heat maps, trend lines, or three shades of conditional formatting on every cell.
Pick the two or three views your managers will use every day and make those fast. The rest is noise that slows the page load and the decision.
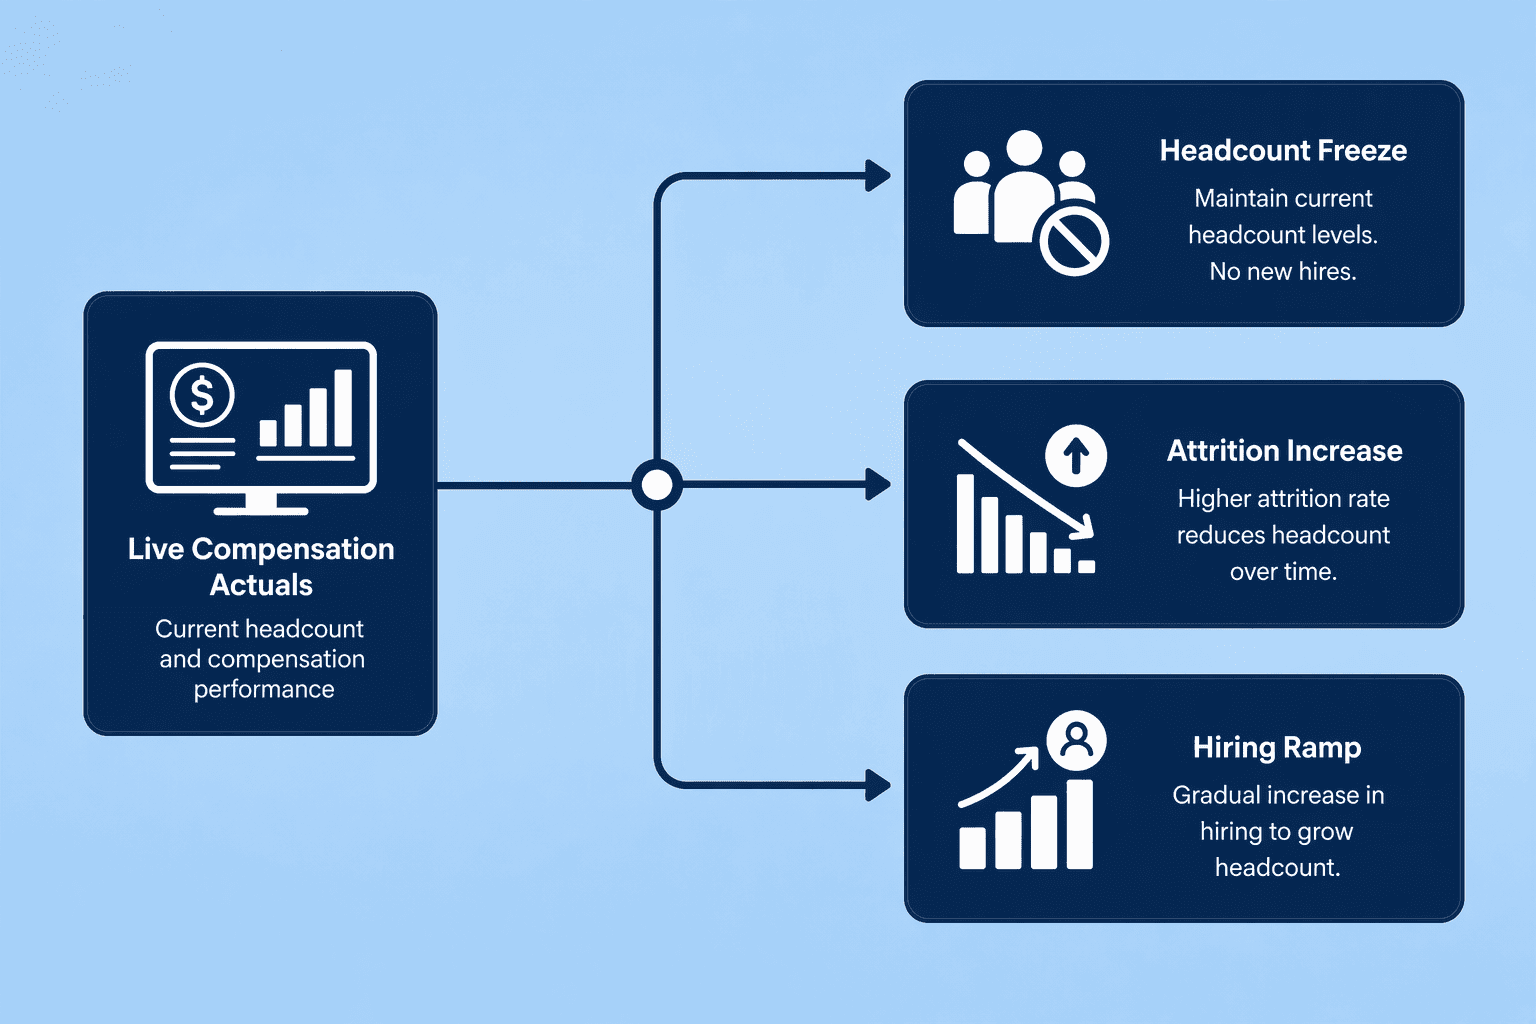
Running what-if scenarios on top of your actuals is where the competitive advantage sits. Follow this sequence to shift from reactive monitoring to strategic workforce planning.
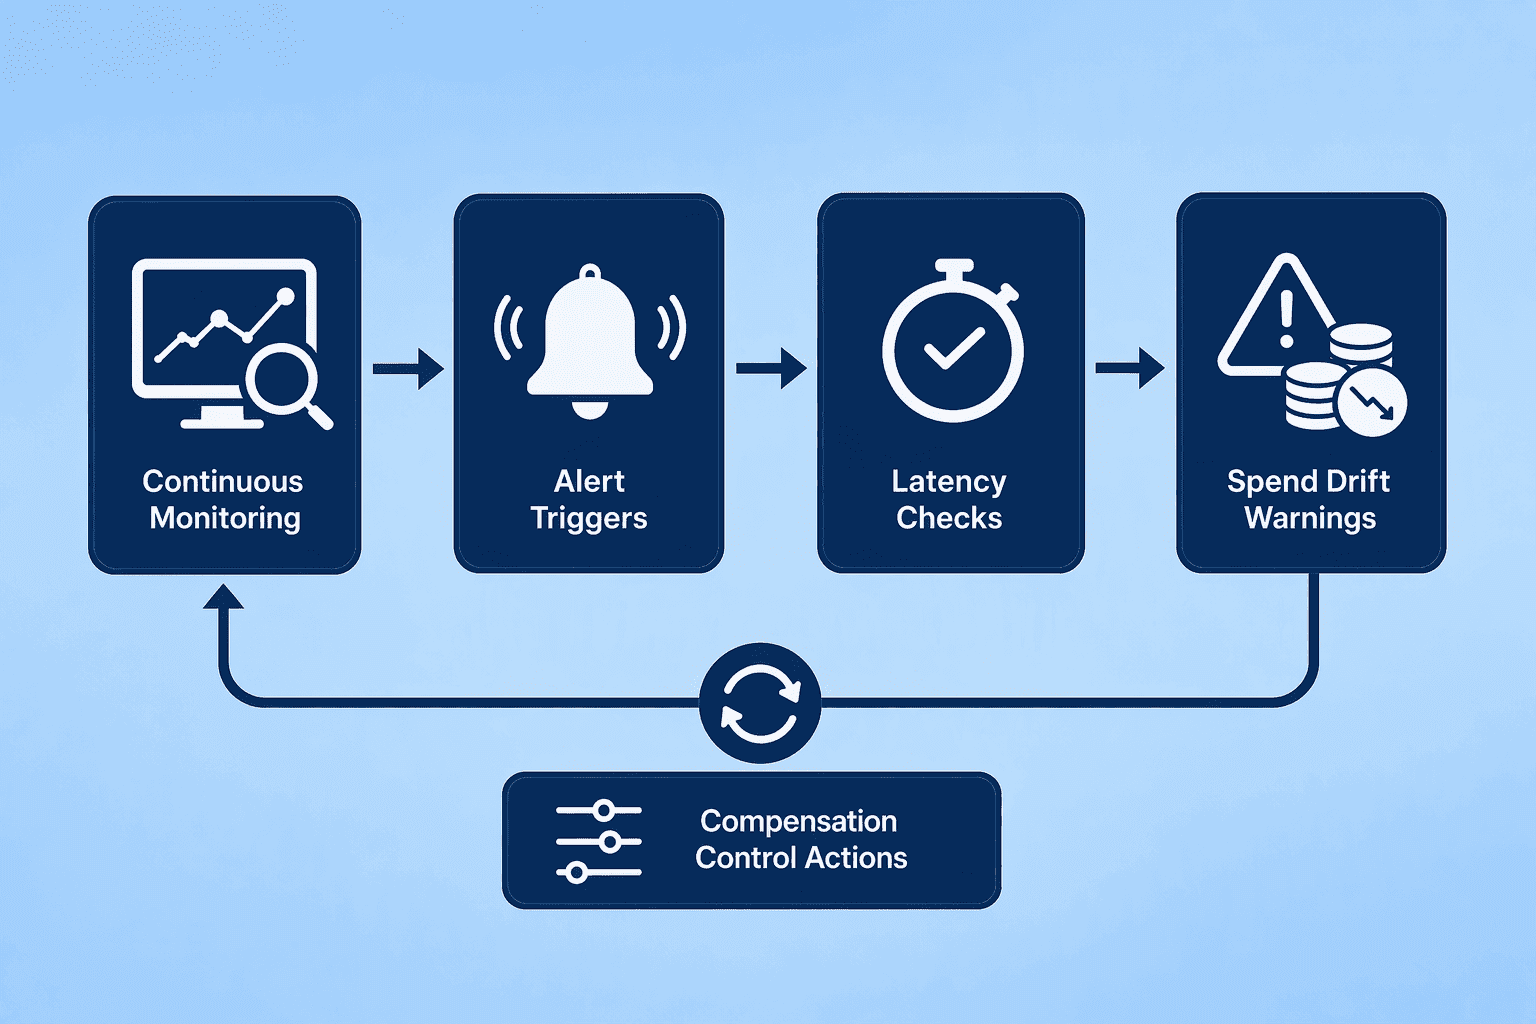
You've built the dashboard. Now the real work begins, keeping it alive with timely decisions. Continuous monitoring flips compensation management from a periodic review into a daily discipline. The goal is not to stare at the screen every hour; it is to set clear triggers that alert you when spend drifts, so you can act before a small overshoot becomes a year-end crisis. Without this, a real-time dashboard is just a faster rearview mirror.
The most common technical obstacle is data latency. Your dashboard is only as fast as its slowest feed. Accounting systems often sync nightly, while invoice reconciliations close monthly.
To avoid a false sense of security, prioritize the data streams that show money leaving the business first. Card transactions and live ERP feeds give you a near-instant pulse on actual spend. For SaaS tools with variable pricing, layer in usage data so that a sudden spike in per-seat consumption registers before the invoice ever arrives.
Specialized systems can help: Workday automates and streamlines 80% of compensation processes, significantly reducing the manual lag between a compensation event and its appearance in your analytics. You can use a compensation-specialized platform like CompUp to connect payroll, benchmarking, and equity data in one interface, which cuts down the swivel-chair reconciliation that introduces errors and delays.
When your feeds are clean, focus on the metrics that demand a response. Track variance by its drivers. A favorable variance, spending less than planned, can mask a hiring freeze you need to address.
An unfavorable variance on base salary might signal that new hires are coming in above the midpoint, eroding your band integrity. Set automated alerts in your dashboard that flag when "% of Budget Used" by a specific department exceeds the elapsed percentage of the fiscal year. If Q2 ends and Engineering has consumed 65% of its annual merit budget, you have a structural problem.
Tools like Lattice let you filter, compare across, or break down spend analytics by Manager, pinpointing exactly where allocations are bunching up before they become an aggregate shock. Organizations that track variance drivers, pricing changes, volume shifts, and one-time items, can distinguish between a controllable drift and a market force no dashboard can fix.
Real-time compensation tracking is a competitive advantage because it eliminates the delay between a financial decision and its visible consequence. The journey from defining actuals versus commitments to solving the nightly ERP sync bottleneck creates total budget visibility. With that visibility, you shift from forensic accounting, always explaining an overrun after it happens, to agile workforce planning that protects your ability to hire, backfill, and retain talent within the boundaries of the approved plan.
The actionable next step is a three-hour session with Finance and HR to agree on the exact formula for Forecasted Cost at Complete (FCAC) and map the hierarchy of your live data sources, as outlined in Step 2. That session instantly surfaces where your current latency pain points actually reside.
Data clearance is a resource problem. When Finance operates on stale nightly batch data while HR asks for mercurial real-time dashboards, the gap is organizational, not technical. Close that gap by aligning both teams around a single source of truth. The spreadsheet has a replaceable role in this workflow: use it to test shared logic during your first FCAC definition session, then hand the running calculation to a system that connects live payroll, applicant tracking, and ERP feeds. If you're weighing options, CompUp is worth a closer look.
It means monitoring salary, bonus, and equity spend against the approved budget with data that updates as transactions occur, rather than waiting for month-end reports. It requires distinguishing actual payroll cash, committed costs (signed but unpaid), and remaining budget in a live dashboard.
You need the Original Budget, Change Orders, Committed Costs, and Actual Spend. From these, you auto-calculate Variance (Actual minus Budget), % of Budget Used (Actual divided by Budget), and Balance to Finish (Total Budget minus Projected Costs) to project the Forecasted Cost at Complete.
Purpose-built compensation platforms integrate directly with HRIS and payroll systems, automatically rendering Budget vs Actual tables with visual burn-rate trendlines and threshold alerts. While Workday’s automation streamlines compensation processes, dedicated tools like CompUp focus on pay structuring and generate Total Rewards Statements at cycle close.
Start by connecting high-velocity data sources like card transactions and ERP feeds via API, then layer in nightly HRIS payroll registers. Configure the dashboard to display a dynamic Budget vs Actual table, committed cost overlays, and automated alerts on variance thresholds so risks are flagged before the monthly reconciliation.
The biggest challenge is stale data: nightly accounting syncs lag behind real-time decisions, and monthly invoices can hide usage-based pricing surprises. Solve this by prioritizing money-movement feeds over trailing general ledger files and assigning explicit data-hygiene ownership via a RACI matrix to prevent dashboard decay.
Community Manager (Marketing)
As a Community Manager, I’m passionate about fostering collaboration and knowledge sharing among professionals in compensation management and total rewards. I develop engaging content that simplifies complex topics, empowering others to excel and aim to drive collective growth through insight and connection.
Revolutionizing Pay Strategies: Don't Miss Our Latest Blogs on Compensation Benchmarking