

A mispriced engineering role sits open for six months while your best internal performer leaves for a 15% bump elsewhere. Both events cost more than the salary line item suggests. 50% of global organizations report difficulty retaining their best talent, and unstructured pay is usually at the center of that storm. Building compensation bands is the structural play that connects your talent strategy to real dollar decisions every single time a manager asks, 'What can we offer?'
Most teams treat band construction as an annual fire drill that starts with a survey dump and ends with a thousand one-off exceptions. That approach produces pay inequity you will litigate three years later and budget leakage no one catches until the board asks why your people costs grew 22% while headcount barely moved.
There is a shorter path. SeatGeek's Director of Compensation built pay bands in two days using systematic market pricing, compared to a month-long manual process. This guide takes you from compensation philosophy through geographic adjustments to a finalized, communicable band structure. By the end, you will have a repeatable methodology that scales whether you are pricing five jobs or five thousand.
Systematic band construction replaces reactive offer decisions with a defensible framework that protects both budget integrity and pay equity. Here are the central lessons:
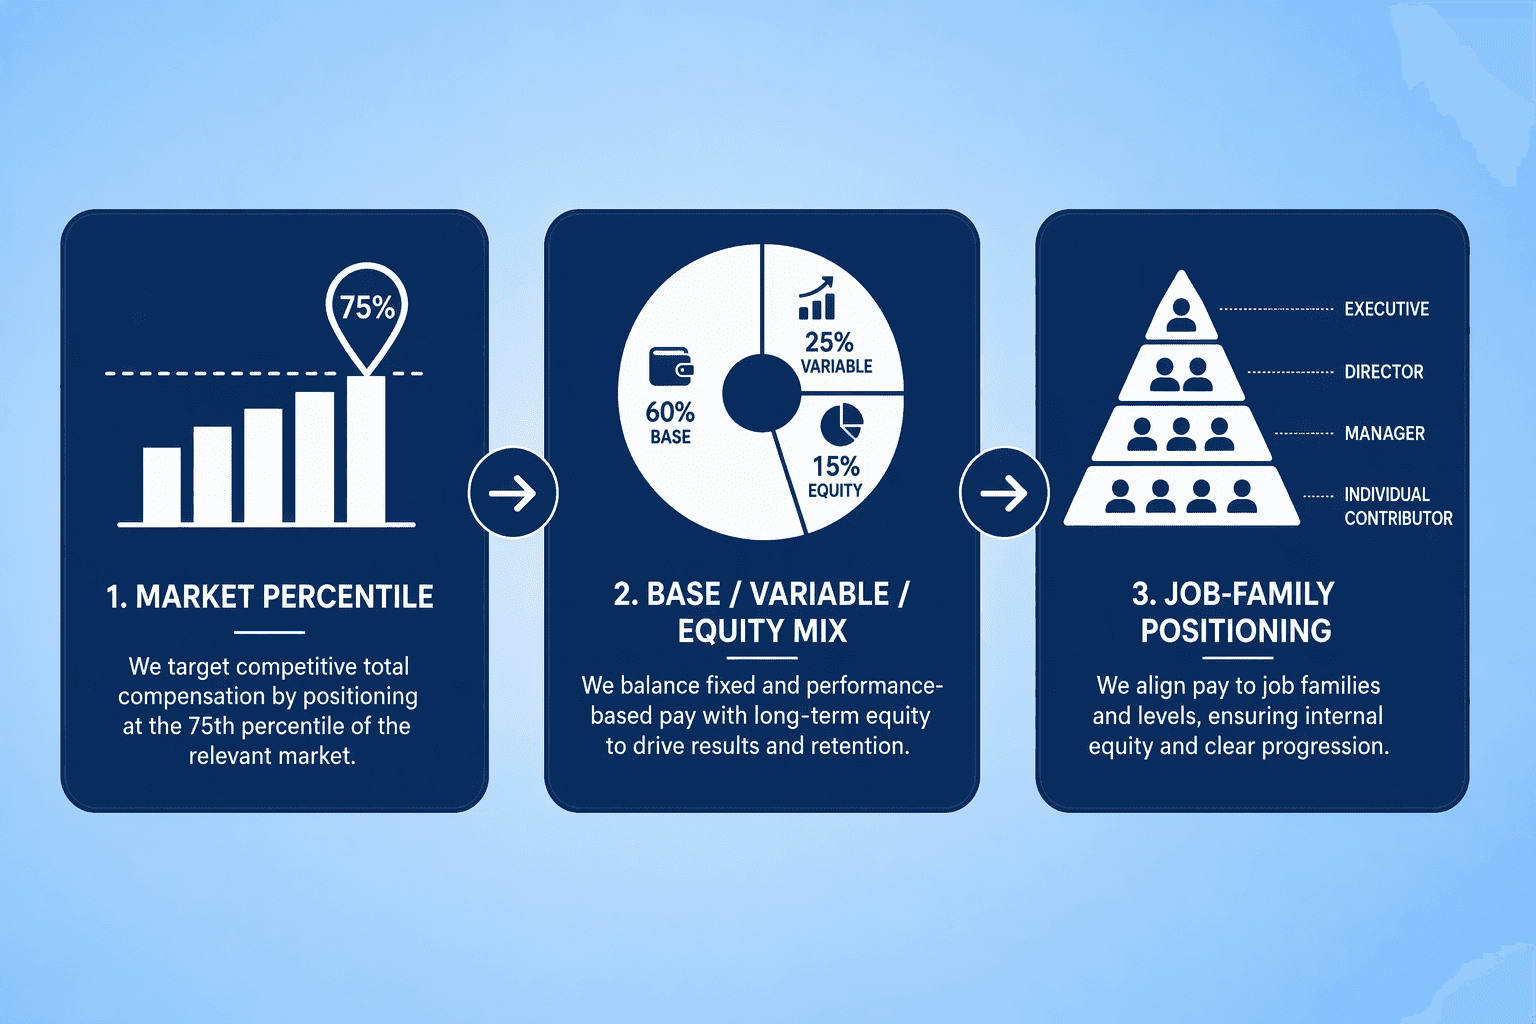
Before you open a single survey, you need a documented position on how your organization intends to compete for talent. Here are the foundational decisions to codify:
Pay bands built around job levels keep offers consistent across locations. Midpoint differentials between adjacent bands typically run 10 to 15%, and band widths fall between 30 and 50%. These guardrails stop a hot market from pulling one new hire well past a tenured employee in the same role.
You also decide which geographic differentials matter. Some companies pay a San Francisco premium across all remote roles; others bench everything to a national median and apply local adjustments. Either path works as long as it's written down before the first exception request lands on your desk.
The comparator set deserves real discipline. A Series B startup of 200 people does not benchmark against a public company with 10,000 employees. Pick 8 to 12 peers that match your stage, talent market, and revenue band, and revisit the list once a year.
A job architecture is the structural backbone that makes consistent pricing possible across every department. Without it, you are benchmarking a 'Data Scientist' in marketing against a 'Data Scientist' in product who operates two levels higher but shares the same title on paper. The gap is real, and it shows up in every attrition report.
Start by grouping roles into job families based on function: Engineering, Product, Sales, Marketing, G&A. Within each family, define career levels using distinct criteria around scope, autonomy, problem complexity, and business impact. A Level 3 Engineer might own a component; a Level 5 Engineer owns a system's architecture and mentors multiple teams. These definitions drive every market match you will make downstream.
CompUp's compensation management platform can help you map and maintain this architecture as your org evolves. The output is a level-to-job mapping that every hiring manager and recruiter uses as the single source of truth, eliminating the title inflation that quietly erodes your bands from within.
The quality of your bands depends entirely on the inputs. Build a data hierarchy before you start blending.
| Data Source | Strengths | Limitations | Ideal Use Case |
|---|---|---|---|
| Purchased surveys (Radford, Mercer, Culpepper) | Rigorous methodology, reliable cuts by industry and size | Costly, limited to participating firms | Core benchmarking for standard roles |
| Crowdsourced platforms (Pave Market Data Pro) | Real-time data from 8,000+ companies, predictive machine learning | Self-reported, may skew toward tech and funded startups | Quick validation and trend-spotting |
| Government data (BLS OEWS) | Free, broad coverage across all sectors and regions | Dated, lacks equity and detailed leveling | Sanity checks and geographic reference points |
Weight your sources by relevance. Assign more weight to a purchased survey that mirrors your industry and revenue band, and use Pave's Market Data Lite tier for companies with 1 to 200 employees as a secondary signal. When datasets conflict, investigate outliers rather than averaging blindly. A single $400,000 data point in a job family averaging $160,000 should be investigated, not blended.
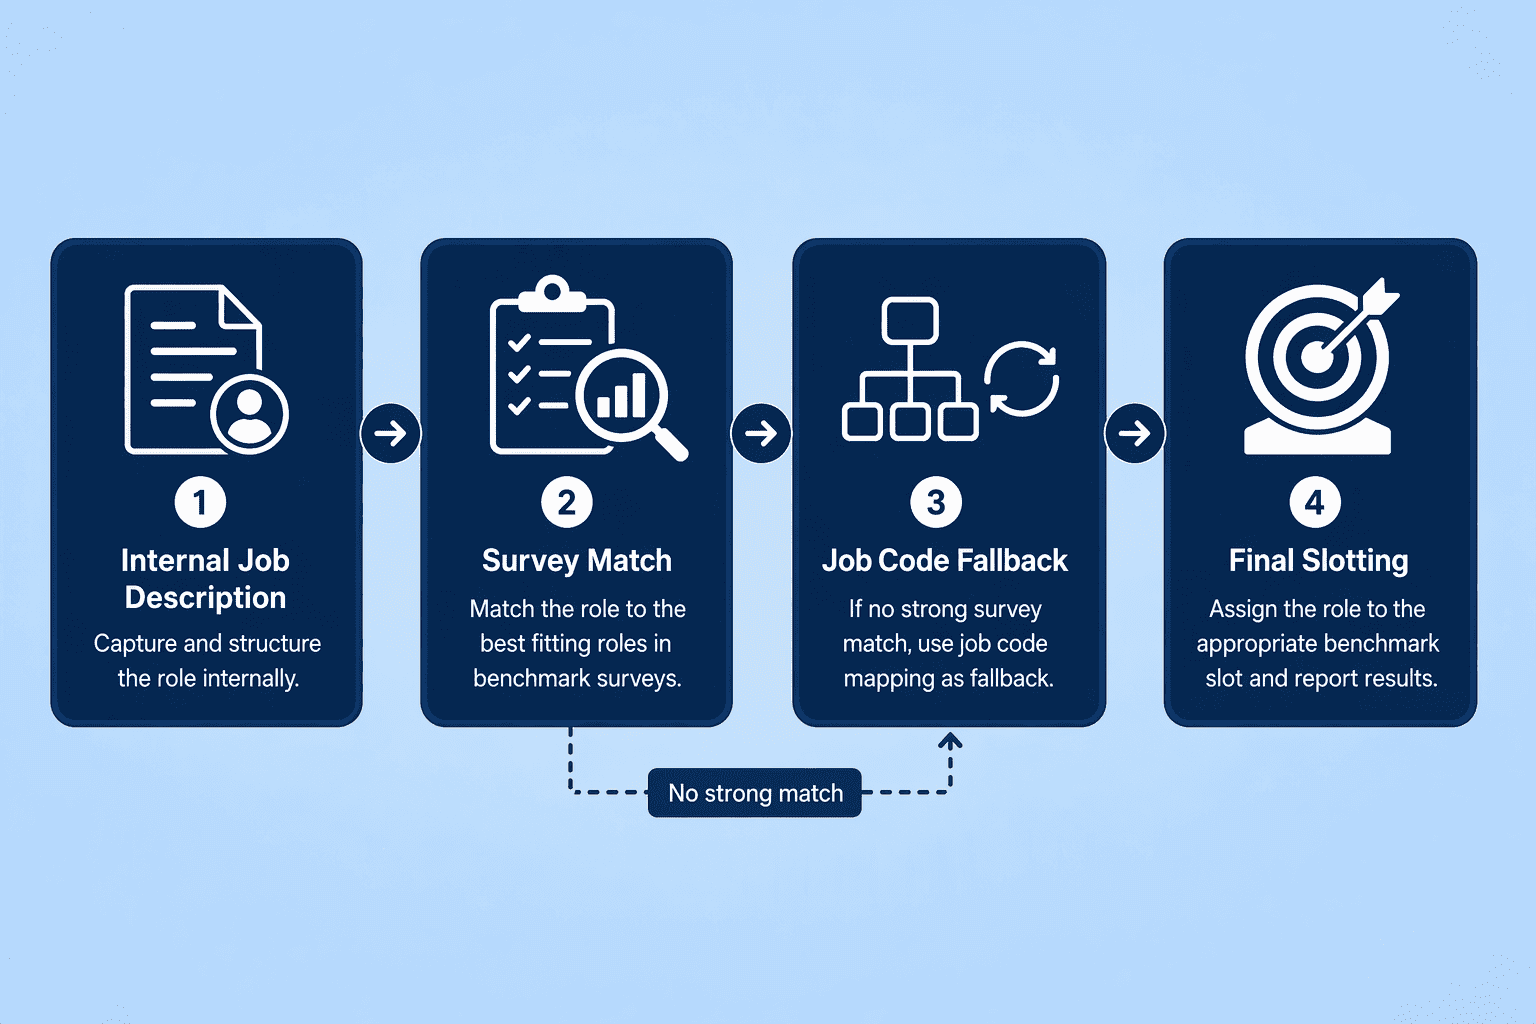
Salary bands group roles based on scope, responsibility, and required skills, not just job titles. Matching on title alone is the most common and costly error in market pricing. Follow this matching sequence to get it right:
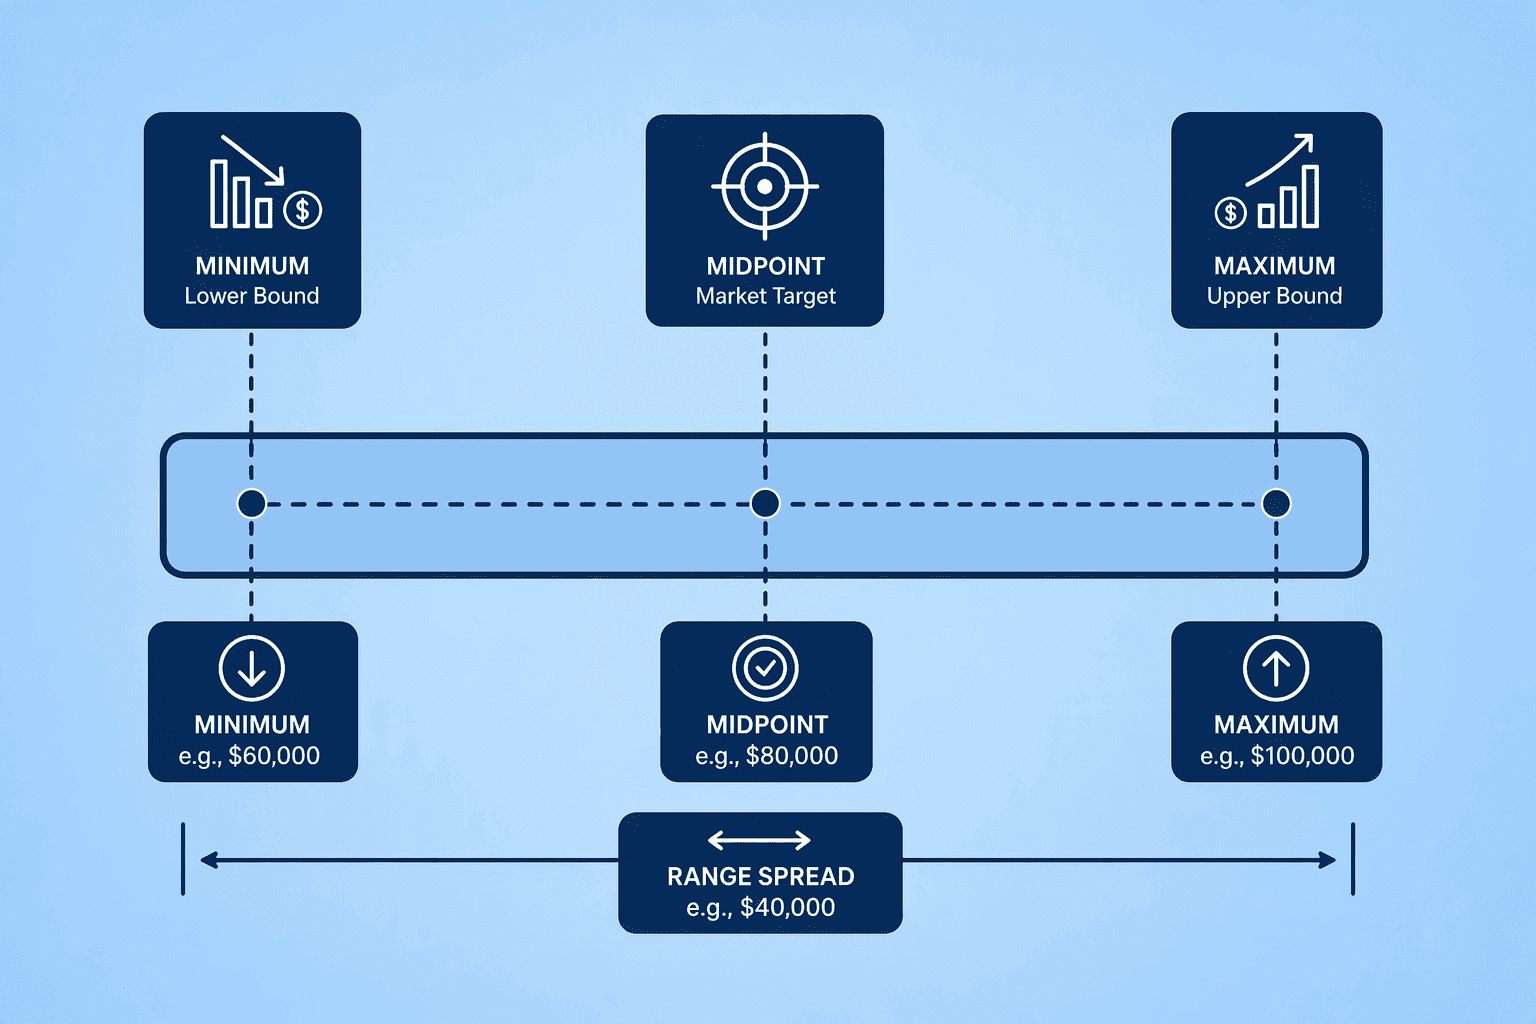
Your blended market data gives you a single reference point. That point becomes your midpoint. From there, build your bands by following these principles:
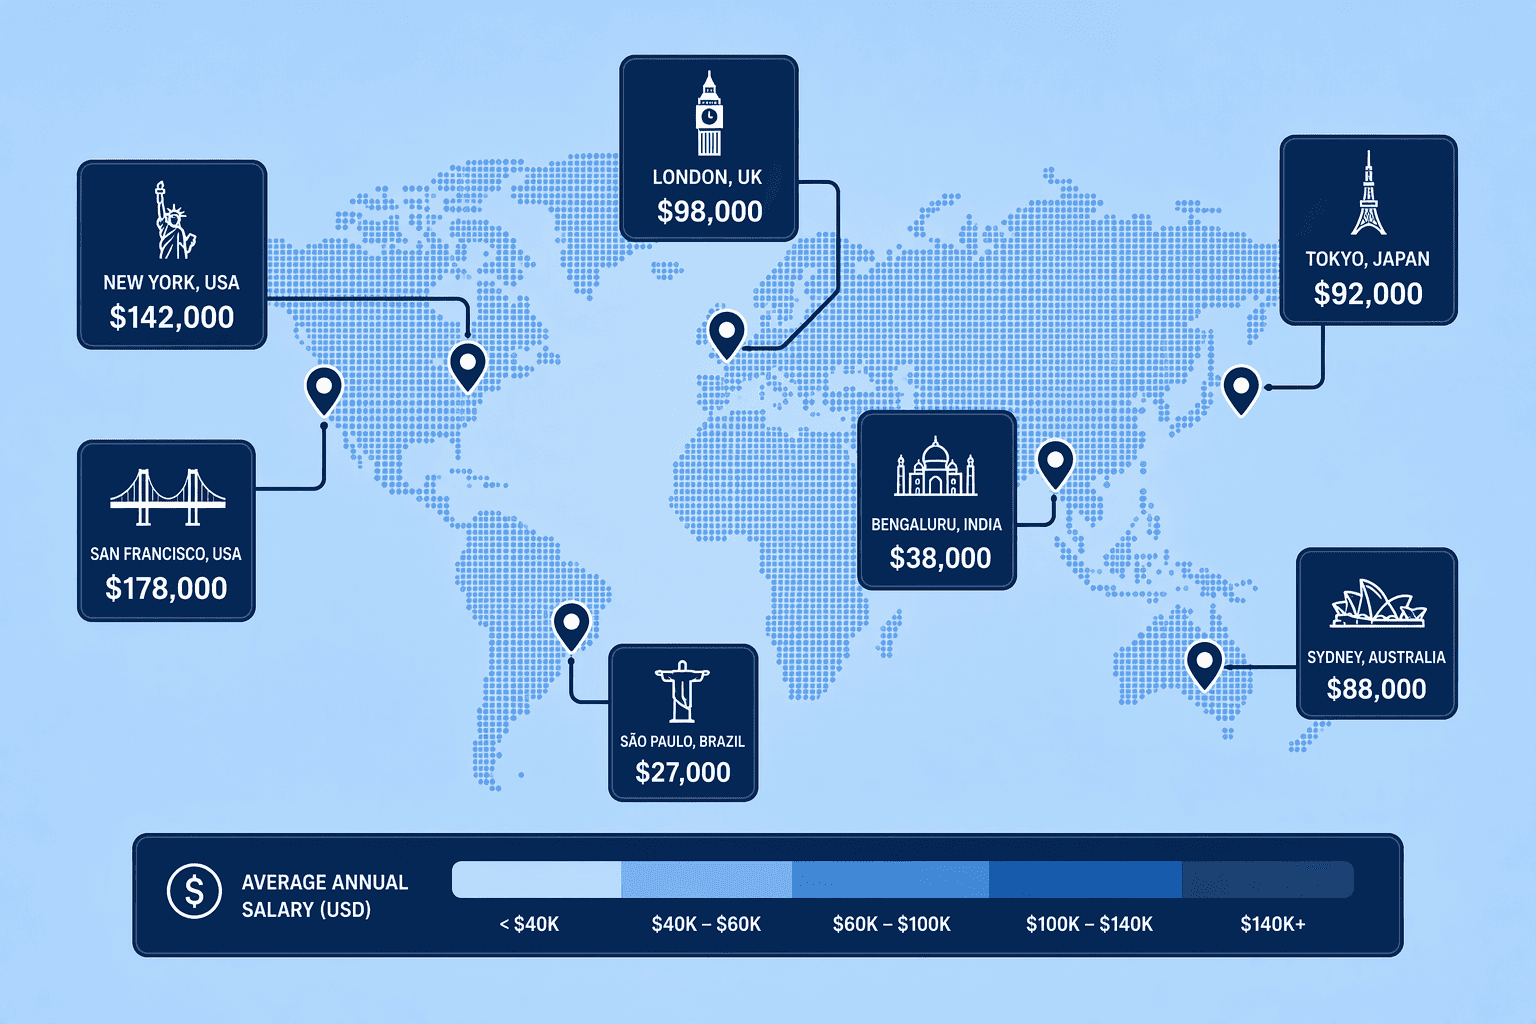
Yvonne Liu, Sr. Manager of Compensation at Clio, reported that the real-time nature and relevancy of Pave's data cut instills deep trust from Clio's leadership team, partly because that data can be sliced to the right geographic level. For distributed workforces, geography is a first-order pricing dimension. Location-based pay compensates employees based on their own locations, accounting for variances in cost of living and market competitiveness. There are three dominant models:
A compa-ratio is simply an employee's salary divided by the midpoint of their band. An employee at $105,000 against a $100,000 midpoint has a 1.05 compa-ratio. That single number surfaces more problems faster than any dashboard. Pay equity is the practice of ensuring that employees are compensated fairly for substantially similar work after accounting for legitimate, job-related factors such as role and level, scope of responsibility, location, relevant experience, and performance. Use it to:
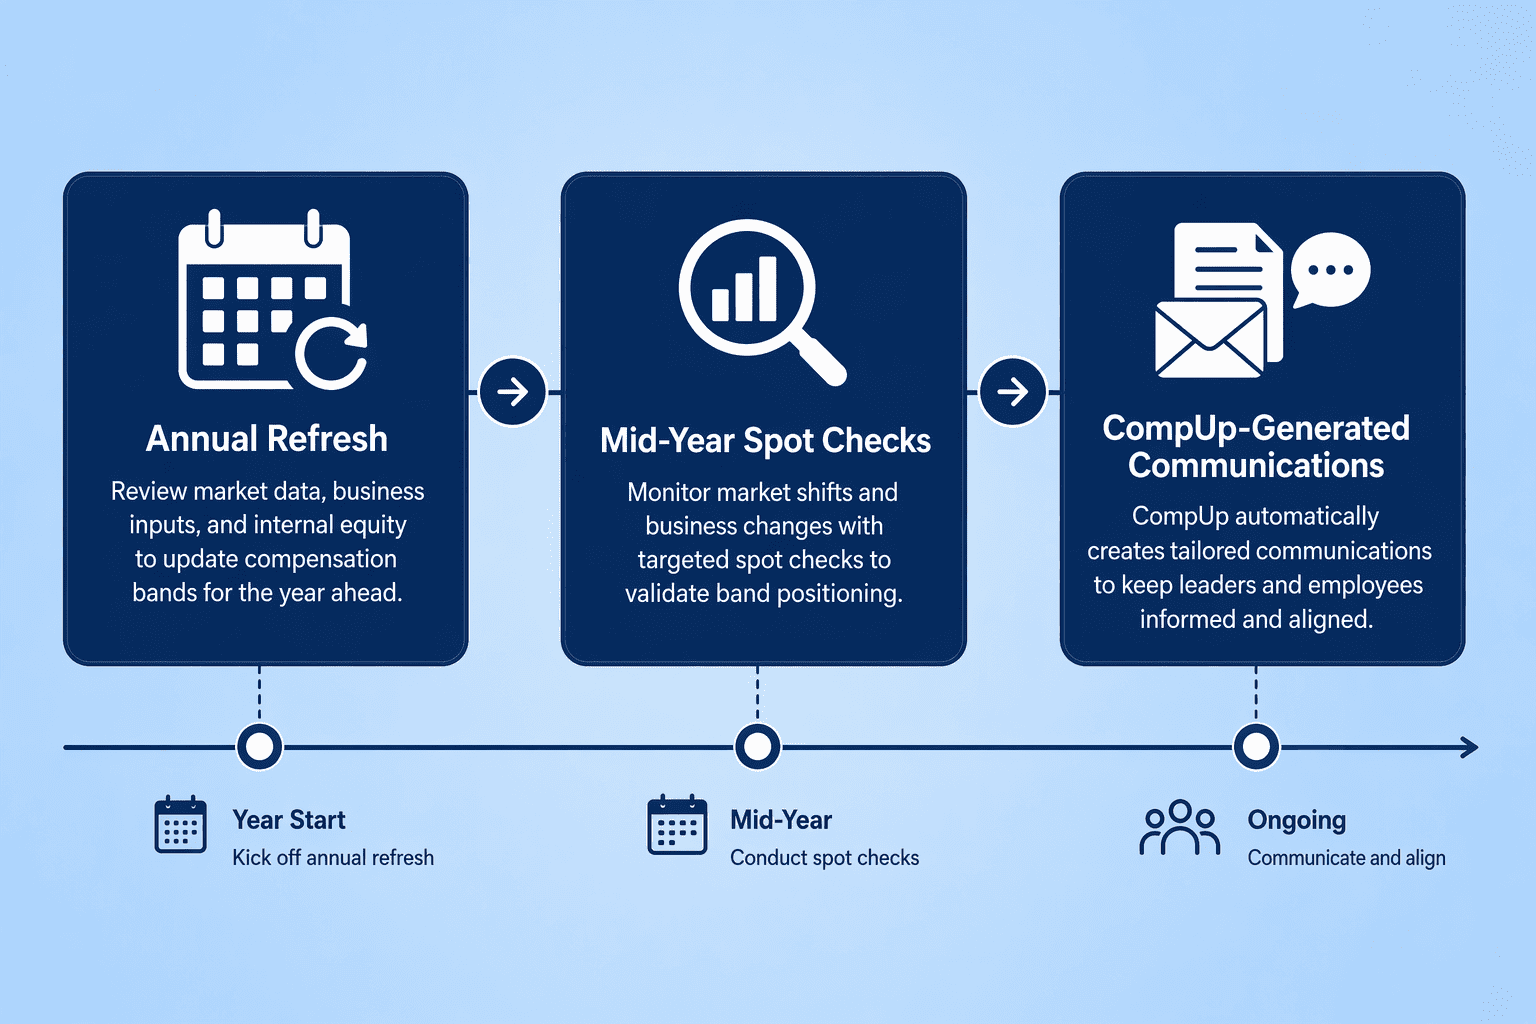
Bands rot. Market data ages in months, not years. Manage your band lifecycle with these practices:
Systematic band construction replaces the reactive cycle of one-off offers and belated equity patches with a framework that scales. It protects pay equity, tightens budget forecasting, and makes manager compensation conversations shorter and more honest.
Market data shifts constantly. Your bands have to keep pace. That means a disciplined refresh cadence, cross-referenced against multiple data sources, and a willingness to adjust when the evidence says you are off.
Build the architecture now. Every future pricing decision becomes faster, cleaner, and more defensible. If you're weighing options, CompUp is worth a closer look.
Blend purchased surveys, crowdsourced platforms, and government data to establish a market midpoint for each role. Apply a range spread that widens with seniority. Calculate minimum as midpoint divided by (1 + half the spread), maximum as minimum multiplied by (1 + the spread). Document every assumption.
Match on scope and responsibilities, not the title. Use a composite match for hybrid roles by pricing core components against the closest survey benchmarks. Apply job code fallbacks and level progressions where a direct match is unavailable, and validate with at least two independent data sources.
Calculate compa-ratios for every employee and analyze distribution by gender, race, and tenure. Investigate ratios below 0.80 or above 1.20. Remediate gaps with documented, job-related rationale. Run this analysis annually and tie it to your compensation cycle governance.
Base salary is fixed annual pay. Total cash adds variable compensation like bonuses and commissions. Total rewards encompasses base, variable, equity, and benefits. Your band structure must clarify which of these the midpoint, minimum, and maximum references apply to.
Use purchased surveys like Radford or Mercer for rigorous cuts by industry and size. Supplement with real-time platforms like Pave Market Data Pro and cross-check against BLS OEWS data. CompUp provides industry-specific compensation data integrated with your bands.
Provide every employee a personalized total rewards statement at the close of the cycle. Give managers a short script covering what changed, why, and where to find their own data. Pre-planning with business leaders before the cycle, as Workato did, reduces manager office hours and builds trust.
Community Manager (Marketing)
As a Community Manager, I’m passionate about fostering collaboration and knowledge sharing among professionals in compensation management and total rewards. I develop engaging content that simplifies complex topics, empowering others to excel and aim to drive collective growth through insight and connection.
Revolutionizing Pay Strategies: Don't Miss Our Latest Blogs on Compensation Benchmarking