
Your employees might be walking out the door for what looks like a better offer, completely unaware they're leaving a huge chunk on the table.
They see only their paycheck, a number that excludes employer-paid health premiums, retirement matches, equity grants, and paid time off. This invisibility creates a dangerous gap. Talented people make career decisions based on incomplete information, and organizations lose them despite investing significantly more than base salary alone.
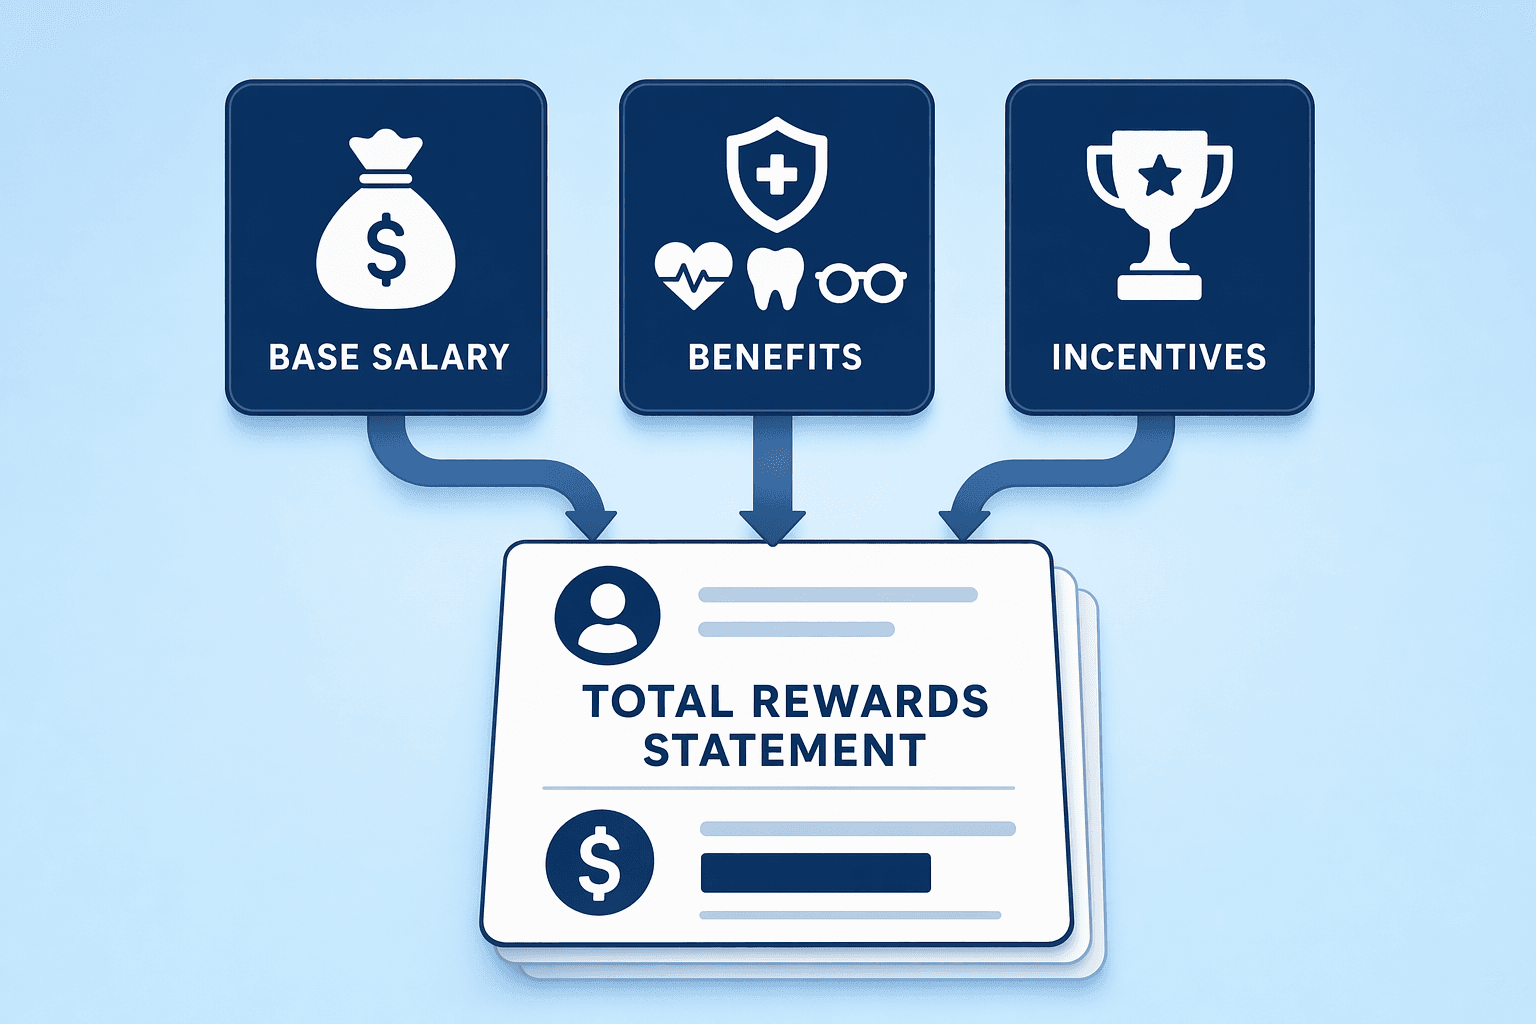
A total rewards statement solves this problem by consolidating every component of compensation, cash and non-cash, into a single personalized document that reveals the full value of what the employer contributes, turning hidden investment into visible, retention-driving clarity.
A total rewards statement is a thorough, personalized document that provides employees with a full outline of their compensation, benefits, and other incentives.
It translates the employer's investment into a single, easily digestible format that shows the complete value proposition beyond base salary. Pay usually makes up about 70% of total compensation, while employee benefits make up about 30%.
Total rewards statements typically break down employer investment across these categories:
Total rewards statements are not legally required in most jurisdictions, but they serve as a transparency best practice that helps employees understand the full scope of employer investment.
You can learn how to implement these statements in your compensation management workflow.
Most employees significantly underestimate how much their organisation invests in them. They see their base salary, mentally subtract tax, and form a view of their compensation from that number alone. Everything else, the insurance premium paid by the employer, the retirement contribution, the equity grant, etc. is either invisible or forgotten by the time the next appraisal conversation comes around. Let's explore how a total rewards statement fixes that:
1. Closes the employee perception gap: A TRS makes every component of the organisation's investment visible in one place, replacing assumptions with an accurate, complete picture of total compensation.
2. Reduces post-appraisal attrition: A statement delivered at the close of the appraisal cycle gives employees the context to evaluate their increment fairly, rather than forming a conclusion based on the percentage alone.
3. Supports pay transparency: Employees see exactly how their compensation is structured and what each component is worth, without requiring the organisation to disclose what colleagues earn.
4. Reduces ad hoc compensation queries to HR: When employees can reference their full package themselves, the volume of inbound questions to HR and managers drops significantly throughout the year.

Despite their proven retention benefits, only 36% of employers currently provide total compensation statements. Top-performing companies and enterprise organizations are disproportionately represented in that minority, signaling a competitive advantage still waiting to be captured by the broader market.
With the strategic rationale in place, the next step is building the statement itself.
Building an accurate total rewards statement requires systematic data collection across every compensation component. Total compensation includes pay, employee benefits, and other incentives, with pay typically making up about 70% of total compensation and employee benefits about 30%.

Here's the data that you need to collect:
Cash Compensation: Pull base salary, bonus payments, and commission data from your payroll systems. Export year-to-date totals and annualized projections for each employee, capturing performance bonuses, sales commissions, and mid-year adjustments.
Benefits and Perks: Coordinate pulls across these platforms:
Equity Compensation: For equity compensation, unvested or illiquid equity may require fair-market-value or strike-price assumptions. Consult your equity plan documentation and finance team to determine the most accurate representation for employee-facing statements.
Once data is collected from disparate systems, the next challenge is transforming inconsistent outputs into a unified, comparable format.
All compensation components must be expressed in annual dollar values to enable market comparison. Without standardization, data from payroll, benefits administration, and HRIS appears in conflicting units (monthly, per-pay-period, quarterly) that obscure the complete picture.

Here's how you do that:
First, convert mid-year hire salaries to annualized figures by multiplying by 12. A $500/month wellness stipend becomes $6,000 annually; quarterly bonuses are multiplied by four. Every employee sees compensation on the same 12-month scale regardless of hire date or benefit frequency.
Once that's done, establish consistent category labels that group system outputs into 4-5 top-level buckets: Cash Compensation, Health & Welfare, Retirement Savings, Time Off & Flexibility, Professional Growth. Map each source field (payroll gross, insurance premium, 401(k) match, tuition reimbursement) into the appropriate bucket. Tailor category definitions to organizational priorities.
With standardized data in hand, the next step is calculating the precise dollar value the employer contributes for each employee's elected benefits.
Employees see premium deductions on every paycheck but rarely know the employer's contribution. A total rewards statement must show both portions to reveal the full value of benefits.

There are multiple things to calculate here:
Employer-Paid Health Insurance Costs
To calculate employer-paid health insurance per employee, start with the annual premium for each coverage tier (employee-only, employee-plus-spouse, employee-plus-children, family), then multiply by the employer's contribution percentage.
For example, if the annual premium for employee-only medical coverage is $8,000 and the employer pays 80%, the statement shows $6,400 as the employer-paid benefit. For family coverage at $14,000 annually with the same 80% employer share, the value is $11,200. Apply the same method to dental and vision premiums.
Many benefits platforms export enrollment data with premium amounts by coverage tier, making it straightforward to join employee elections with cost tables. For organizations managing multiple plans or regional rate variations, tag each employee record with their specific plan ID and tier to ensure accurate cost attribution.
Retirement contributions depend on match formulas. The most common structure is a dollar-for-dollar match up to a percentage of salary. If the employer matches 100% up to 4% of salary, an employee earning $100,000 who contributes $8,000 receives a $4,000 match (capped at 4% of the salary base).
For example, for a 4% match on a $100,000 salary with an $8,000 employee contribution, the employer match is $4,000. If the employee contributed only $2,000 (2%), the match would be $2,000, the employer matches what the employee deferred, up to the cap.
Some plans include profit-sharing or non-elective contributions, calculated as a flat percentage of salary regardless of employee deferrals. These appear as a separate line item. Statements typically show the full annual contribution value even for unvested amounts; note vesting status in the fine print.
Other Employer-Paid Benefits and Perks
For group life and disability policies, the employer pays a fixed premium per employee based on age and coverage tier. Pull rates from your carrier's billing file and map them to each covered employee.
Wellness and professional development budgets are harder to allocate individually unless usage is tracked. If every employee has a per-employee-per-year license fee, assign that cost directly. For shared budgets (e.g., a $10,000 training fund for 50 people), allocate evenly ($200 per employee) or attribute actual usage when participation data exists.
Accurate calculations form the backbone of the statement, but effective design determines whether employees will actually engage with the information.
Accurate data is only half the job. How the statement is presented determines whether employees engage with it or set it aside. Here's what you need to know about the template design:
Visual Hierarchy and Layout Principles
Position the summary total at the top so employees see their total rewards value immediately. Use a pie or bar chart to visualize cash compensation versus benefits; dashboards and visuals improve comprehension over text tables.
Follow with category-by-category breakdowns splitting employer and employee contributions. Include footnotes for equity valuation methods, annualization notes, and pro-rated figures.

Personalization and Employee-Specific Data
Each statement must include the employee's name, role, and actual elected benefits, not generic plan descriptions. A pre-populated Excel spreadsheet with pre-defined formulas makes customization straightforward and ensures every statement reflects individual data.
A statement that sits in a shared drive nobody visits or an email attachment nobody opens has no impact. Getting delivery right is as important as getting the content right. Here's how to get it right:
Delivery Channels: Self-Service Vs. Email Distribution
Modern organizations use HRIS employee portals or self-service dashboards like the UNT System HR Employee Self Service Portal, where employees access personalized statements on demand. This ensures 24/7 availability and smooth updates.
For organizations without portal infrastructure, PDF email distribution serves as a fallback, though it sacrifices real-time access and year-round availability.

Update Frequency and Timing
Annual distribution establishes the baseline cadence, typically aligned with fiscal year-end or merit cycle completion. Organizations undergoing significant changes (policy updates, equity refreshes, benefit redesigns) may opt for semi-annual or quarterly updates. The right frequency depends on organizational dynamics rather than a fixed schedule.
Measure Engagement and Feedback
Track qualitative engagement signals like email open rates for PDF distributions, portal login frequency for self-service systems, and pulse survey responses about total rewards clarity and perceived value. These signals tell you whether the statement is landing and where to improve it in the next cycle.
Even well-resourced HR teams fall into predictable traps when building total rewards statements. Here are the most common ones and how to avoid them.
CompUp is a full-stack compensation management platform designed to take total rewards communication from a once-a-year manual exercise to a continuous, automated process. Here is how its features support everything covered in this article:
Trusted by 100+ companies across 140+ countries, CompUp is built for organisations that want total rewards communication to be accurate, personalised, and timely.
A total rewards statement is not a compliance exercise, it is a retention tool. The organisations that treat it as one design it differently. Most employees who leave citing compensation as the reason do so not because they are underpaid, but because they never had a clear picture of what they were actually earning. A well-executed total rewards statement closes that gap before it becomes a resignation letter. Have a demo with CompUp today and learn more about how we can transform your compensation strategy.
A total rewards statement is a thorough, personalized document that shows employees their base salary, bonuses, equity, employer-paid benefits, retirement contributions, and perks expressed in annual dollar terms [1][2]. It translates the full value of employer investment into a single, easily digestible format that goes beyond take-home pay.
No, total rewards statements are not legally required in most jurisdictions [1][2]. However, they serve as a transparency best practice that helps employees understand the full scope of employer investment and are increasingly adopted by top-performing companies to improve retention and engagement.
Annual distribution establishes the baseline cadence for most organizations, typically aligned with fiscal year-end or merit cycle completion. Organizations undergoing significant changes, policy updates, equity refreshes, or benefit plan redesigns, may opt for semi-annual or quarterly updates to keep statements current and relevant.
Take the total annual premium for the employee's elected coverage tier (e.g., employee-only, family) and multiply by the employer contribution percentage. For example, if the annual premium is $8,000 and the employer pays 80%, the statement shows $6,400 as the employer-paid contribution.
You need payroll systems for base salary and bonuses, benefits admin platforms for health/dental elections and premiums, 401(k) recordkeepers for retirement contributions, equity management systems for grants, time-tracking systems for PTO balances, and program enrollment data for wellness and professional development [3][4][5].
No, personalization is key. Each statement must show the individual employee's actual compensation, elected benefits, and employer contributions, not generic plan descriptions [7][8]. Using a universal template dilutes impact and undermines the perceived value of the statement.
Unvested or illiquid equity may require fair-market-value or strike-price assumptions rather than current market value [1]. Include a footnote explaining the vesting schedule and valuation assumptions, especially for private company stock where market liquidity is limited or nonexistent.

Customer Success Manager
Driven with the aim of becoming a valuable subject matter expert in the world of Total Rewards to be able to deliver exceptional customer experiences.
Revolutionizing Pay Strategies: Don't Miss Our Latest Blogs on Compensation Benchmarking


