
You open the Q3 hiring plan spreadsheet, and the salary bands your team spent six weeks building last January are already wrong. A competitor just raised its software engineer midpoint by 8%, your Denver office suddenly demands a geo-differential you don't have modeled, and your CFO is asking whether the ranges are compliant with three new state pay-transparency laws. The annual spreadsheet isn't just tired. It's a liability.
By 2026, manually updating bands from discrete survey PDFs is obsolete. Compensation management platforms now deliver market data as a continuous, automated feed. This guide walks through the three-layer architecture, market data definition, job mapping, and a dynamic band engine, that makes self-adjusting bands operational.
Automated compensation bands live or die on five things: philosophy, live data, clean job architecture, data quality, and governance. Skip one and the machine will faithfully scale your mistakes.
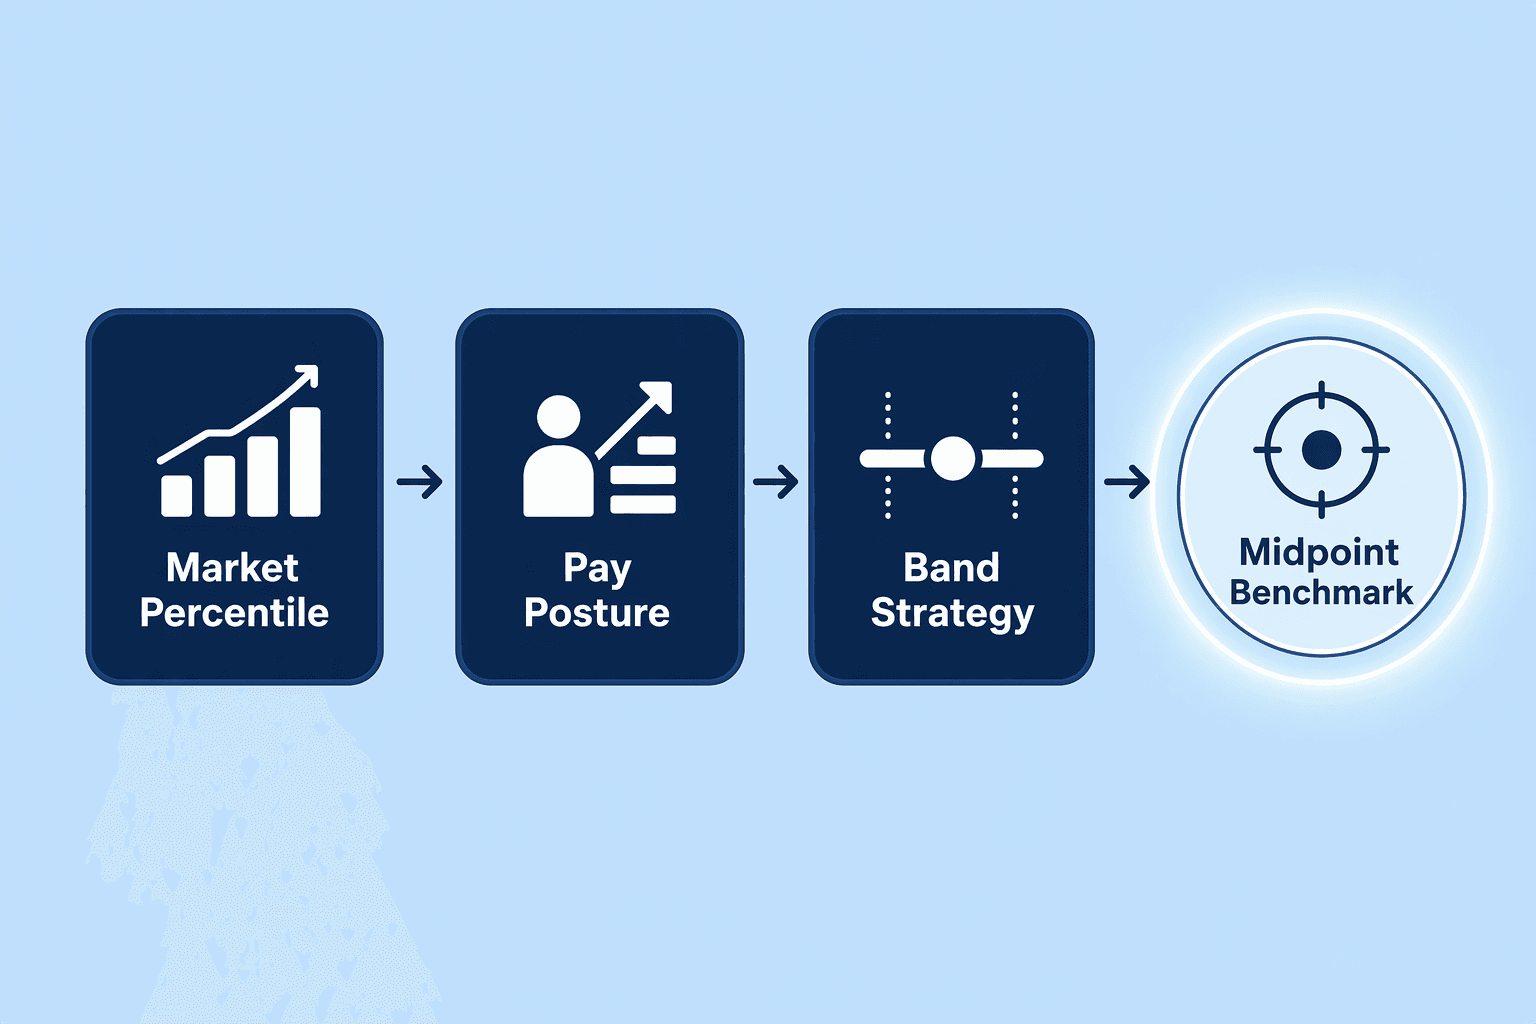
Your compensation bands are a direct expression of your talent strategy, and no platform can set that strategy for you. The automation you build in later steps will faithfully reproduce whatever policy you hardcode up front, so ambiguity here gets amplified at scale.
| Decision Area | Common Option A | Common Option B | What It Determines |
|---|---|---|---|
| Target Market Percentile | 50th percentile (market median) | 75th percentile (market-leading) | The midpoint benchmark your bands will anchor to. Most organisations begin by targeting the 50th percentile for midpoint. |
| Band Model Scope | Base salary only (bottom-up) | Total cash including variable pay (top-down) | Whether your band limits govern fixed pay or an employee's full cash package. A top-down model applies to roles where bonus or commission is a material component. |
| Geographic Differentiation | National single rate | Per-region multipliers or distinct city bands | How sharply the band responds to cost of labor differences. The most common pattern is per-region multipliers, easy to maintain and provides a defensible rationale. |
| Band Grouping Approach | Role-based bands grouped by job family and level | Company-wide or department-wide bands that span multiple roles | How many distinct market benchmarks pool into each band. The number of job titles included in a band determines how many benchmarks contribute to that band's data. |
Document this philosophy in a one-page statement your compensation committee signs off on. The percentile you choose, the band scope, and the geography model become the configuration rules in every subsequent step.
Continuous band adjustment cannot operate on a quarterly CSV someone downloaded from a survey vendor’s portal.
In 2026, platform categories have split clearly. Workforce planning tools like Anaplan, Pigment, or Visier model headcount budgets and scenario labor costs. Compensation management platforms handle the narrower, deeper problem of pricing jobs against external market data. CompUp, for instance, is a compensation-first platform built for HR and Total Rewards teams that runs compa-ratio tracking and pay equity analysis alongside band modeling. Platforms such as Ravio let you auto-create a strong salary band structure from scratch using real-time market data, while solutions like Pave automatically integrate market benchmarks to define compensation bands for employees in a given role and location.
The critical evaluation criterion is whether the platform connects directly to a live survey benchmark feed. Workday, for example, embeds real-time market benchmarks from Compa directly into the compensation review process. Dayforce allows you to define and map survey data sets so that only the columns for the 25th, 50th, 75th, and 90th percentiles are used in compensation worksheets.
Scrutinize integration depth too: some platforms offer an API that refreshes overnight, others update in near real time. Check whether the platform pushes notifications when a market shift breaches a threshold, as AxisSynapse does when refreshes raise the midpoint by more than the workspace’s sensitivity threshold. Without a live data pipeline, you have a faster spreadsheet, not automation.
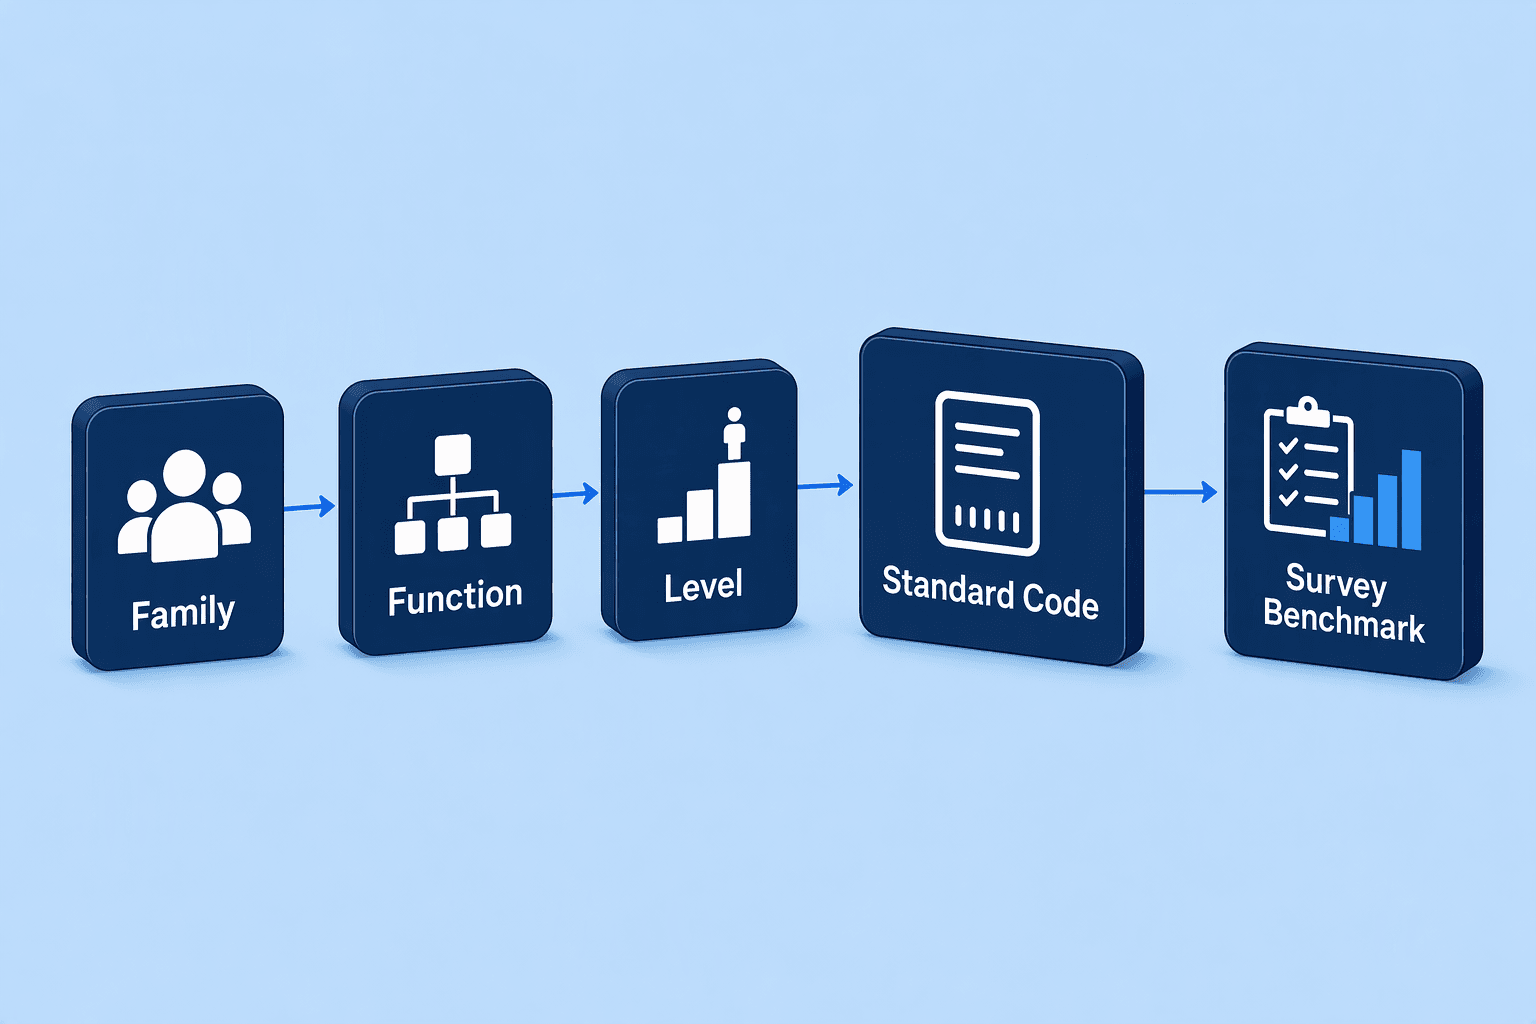
The mapping layer is where your internal labels meet the market's definitions. It will fail silently if every department uses its own title for a mid-level software engineer.
A standardized job architecture assigns every role a consistent family (like Engineering), function (like Backend Development), and level (like P4). That code becomes the primary key for matching to external survey benchmarks. Without this taxonomy, even a live market data feed produces garbage matches.
The engine cannot know that "Web Wizard" and "Platform Engineer III" should pull the same benchmark. Build this architecture level-agnostic to titles. Focus on scope of responsibility and required competencies, then slot your current roles into that structure.
Companies typically base salary bands on factors such as job title, level of responsibility, years of experience, and industry benchmarks. Automated banding adds a sharper constraint: the mapping must be machine-readable and unambiguous.
Each job code maps to exactly one benchmark survey role so the platform knows which market data column to pull when the scheduled refresh runs. A well-built mapping layer also handles geographic segmentation, because location-based pay compensates employees based on their own locations, accounting for variances in cost of living and market competitiveness.
The architecture you built in Step 3 is a blank structure. Every active employee record now needs a clean, consistent home inside it. This step decides whether your recalculated bands hold up under scrutiny or collapse the first time a finance partner asks for backup.
This cleansing cycle is the most time-intensive step, and it is what separates a banding system that generates audit-ready output from one the HRBP team refuses to trust on day one.
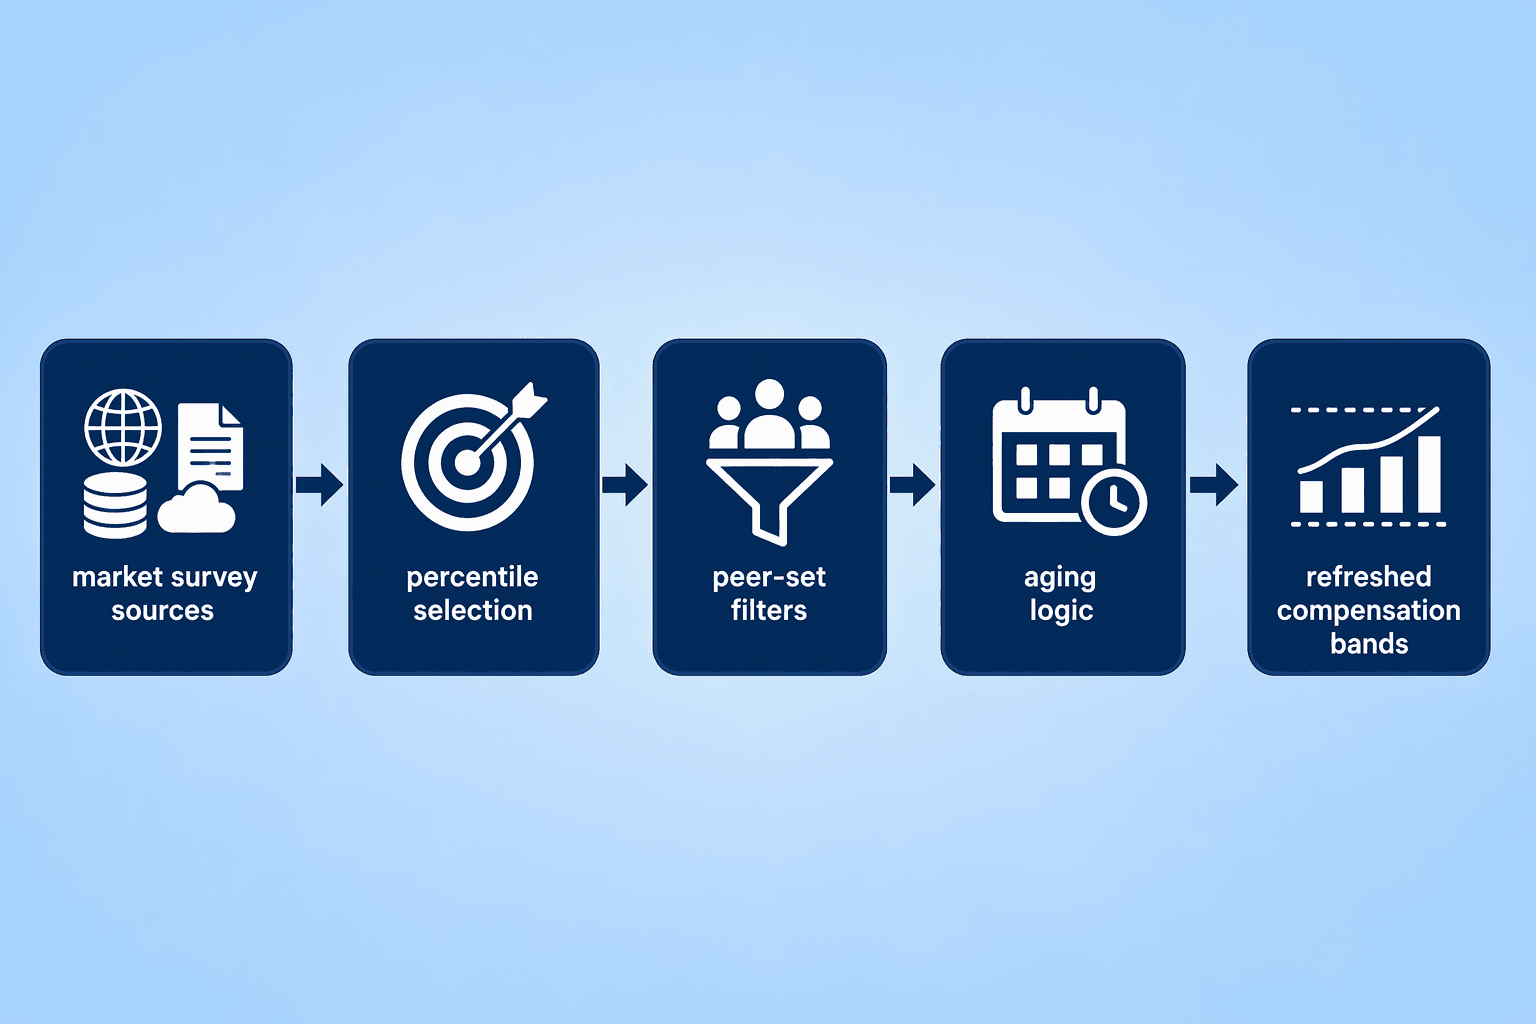
The market data definition layer translates your compensation philosophy into the technical instructions your platform follows at every refresh. You are telling the system which columns of which survey matter, how to scope the peer set, and how to age data to a common effective date.
Start by picking the survey percentiles that govern the bands. For most use cases, the columns for the 25th, 50th, 75th, and 90th percentiles are the ones that populate compensation worksheets, with the 50th and 75th driving midpoint placement. A platform like Dayforce lets you define these in a Market Data Definition by configuring a General section, Columns section, and Mapping section. Once locked into a market data set, that definition can no longer be deleted, a safeguard that prevents downstream configuration drift.
Next, apply peer-group filters. Narrow benchmark inputs by industry, revenue band, and headcount range so a 200-person Series B startup isn't pulling market data from Fortune 50 firms. Most survey providers publish these cuts. Your platform should let you apply them at the job-family or department level rather than as one global filter.
Finally, set the aging rule. Survey data is published at different times during the year. A platform that does not age all inputs to a single common effective date will mix stale and fresh data into an incoherent midpoint.
Confirm whether your chosen platform applies an automated aging multiplier or if you must configure one. The combination of aging rule, peer-group filter, and percentile selection is the engine specification. What fires automatically afterward is that specification recalculating.
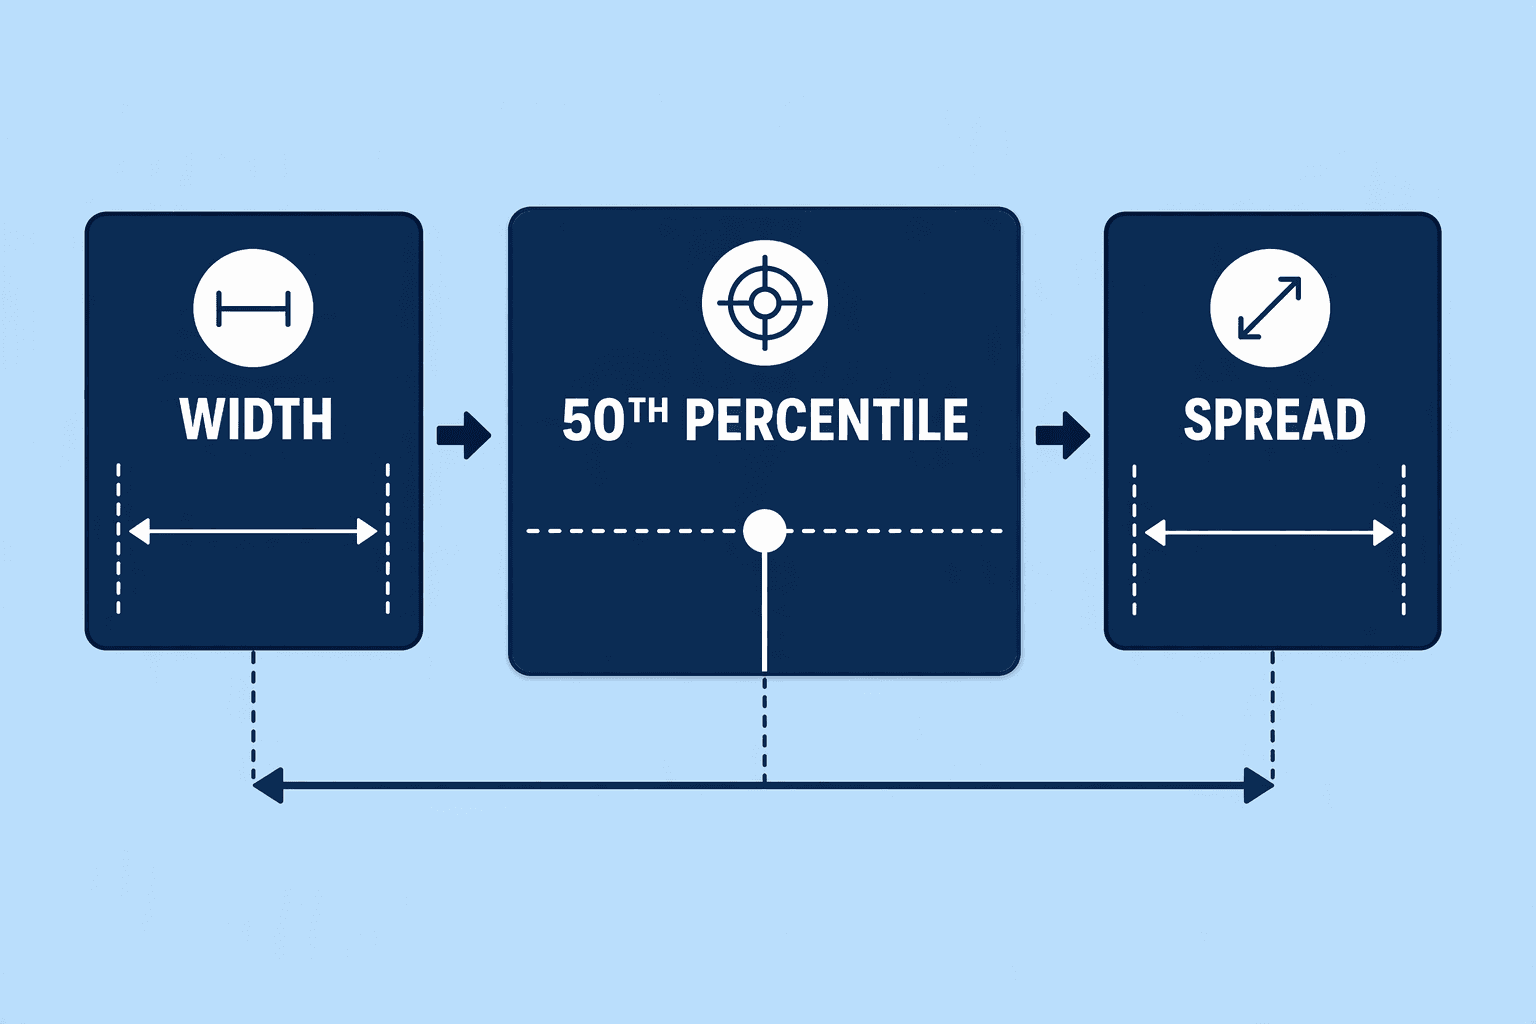
With the market data rules defined, you now parameterize the band engine itself. Two numbers govern every range the system will produce: the target percentile your midpoint anchors to, and the width of the range around that midpoint. Platforms like Ravio automatically connect salary band structures to live market benchmarks so the ranges you set reflect current market pay, but the spread and anchor point are still policy calls you have to wire in.
The midpoint calculation is straightforward: if your policy targets the 50th percentile, the platform pulls that survey column for your mapped job code. If you target the market-leading 75th percentile for certain critical roles, you configure that override at the job-family or role level. When market data is available, the 50th percentile values display in the Market Hourly Rate 50th Percentile or Market Hourly Salary 50th Percentile columns in the worksheet, giving you visibility into what the engine is pulling before it shapes the band. Wide bands accommodate long-tenured employees who progress slowly through a grade.
The market norm for range spread typically sits at 15% to 25% of the midpoint, meaning a $100,000 midpoint produces a range of $85,000 to $115,000 or wider. The formula the engine applies is `Minimum = Midpoint / (1 + [Spread/2])` and `Maximum = Minimum × (1 + Spread)`. High-growth functions like AI research might justify 50% spreads, while clerical or support roles often operate on tighter 15% bands.
This parameterization means your band engine doesn’t produce one static grid. It recalculates every range, for every job code, on every refresh, with width staying constant but midpoints moving as market data shifts. That’s the definition of automated adjustment.
The platform has now ingested live data, mapped it to your job taxonomy, and fired the band engine with your parameters. Before releasing those numbers to managers, pause for a human-in-the-loop validation pass. Automated rules handle the predictable cases. Judgment is for the edge cases and thin-market roles where you want a person overriding the algorithm.
This validation step produces an audit-ready rationale for every manual override. When your next pay-equity audit arrives, you can show that the system proposed a data-driven band and your committee approved it with documented reasoning, not ad-hoc spreadsheet adjustments.
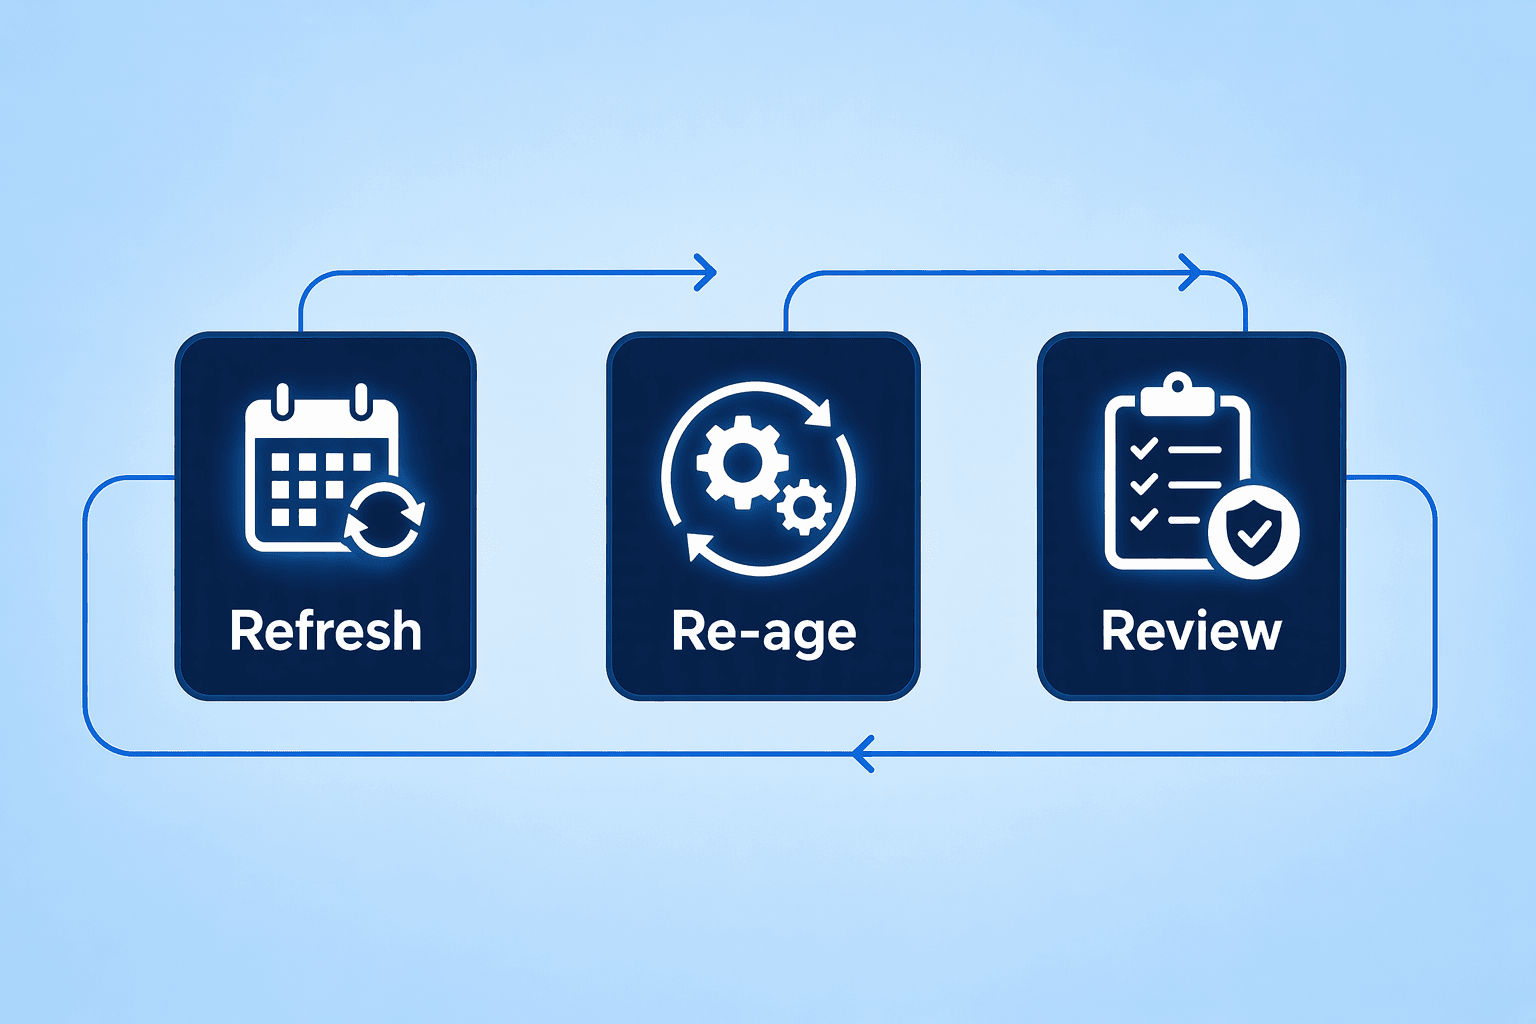
A salary structure that gets stale six months after it's built isn't worth the spreadsheet it's written on. The difference between a one-time project and an actual compensation program is a synchronization engine that keeps bands current without someone manually re-running every analysis.
Set a quarterly refresh cadence. That rhythm lines up with major survey publication cycles without injecting constant churn into hiring ranges and merit budgets. The platform ingests new benchmark data, re-ages every cut to a common effective date, remaps employees through your job taxonomy, and recalculates bands against the same Step 6 parameters.
What comes out is a set of range adjustments. Not change requests. Not a fresh manual project.
The platform will flag exceptions: midpoint shifts above a dollar threshold, roles whose market position jumped two percentiles, bands where your internal compa-ratio just went sideways against the new data. Those flags go to a compensation governance committee, which meets within a week of each quarterly refresh. The committee's job hasn't changed.
It still approves, rejects, or modifies band movements. What's different is the starting point. Instead of interpreting static survey PDFs, your team reviews a structured diff report that zeroes in on material shifts, not noise.
Every adjustment gets a timestamped audit record: the benchmark source, the date it was ingested, the effective date it was aged to, the percentile column it pulled, and the midpoint it calculated. When a disclosure obligation lands, a state pay-transparency filing, an OFCCP desk audit, you hand over that documented lineage. Technology isn't legally required for compliance.
But this audit trail is the most practical way to produce the kind of defensible rationale enforcement agencies expect. This is where automation stops being a tool and becomes compensation infrastructure.
The project phase ended in Step 7. From here forward, your bands are a continuously maintained asset, responsive to the market, governed by policy, and not left to drift on whatever happened to come in the last survey file.
Self-adjusting compensation bands turn a six-month manual slog into something that runs continuously and stays in policy. The work is sequential: you move from philosophy to platform, then to architecture, data sets, rule design, parameters, validation, and governance. Skip a layer and the automation gets brittle. Execute the full sequence and you end up with pay structures that track the market quarter after quarter, build a defensible pay-equity record, and free your HR team to lead on talent instead of reconciling spreadsheets. If you're weighing options, CompUp is worth a closer look.
A compensation platform ingests live market benchmarks, maps them to your job taxonomy, and fires preset formulas to update ranges, so the bands always reflect current external pay rates rather than last year’s static analysis.
In 2026, platforms like Ravio, Pave, Dayforce, and Workday (via Compa) each provide some form of live benchmark ingestion and automated range calculation. Ravio auto-creates bands from real-time data. Pave integrates market benchmarks directly. Dayforce and Workday embed live survey data into compensation worksheets and processes.
Automatic adjustments strengthen pay equity by anchoring every range to a consistent, timestamped market data source. This prevents stale internal anchors from creating inequitable pay gaps. For compliance, a documented audit trail ties each range to a specific benchmark, survey date, and percentile, producing a defensible rationale for external audits and pay-transparency filings.
You need six sequential steps to implement continuous automated band adjustments:
7.
8. Activate continuous synchronization with governance oversight.
Compensation management tools price jobs against external market data and automate merit cycles, compa-ratios, and band adjustments. Workforce planning tools like Anaplan or Visier model headcount budgets, demand forecasting, and organizational design. Compensation tools handle the precise per-role market calibration that automated bands require; workforce planning tools typically don’t automate detailed salary range calculation.
Community Manager (Marketing)
As a Community Manager, I’m passionate about fostering collaboration and knowledge sharing among professionals in compensation management and total rewards. I develop engaging content that simplifies complex topics, empowering others to excel and aim to drive collective growth through insight and connection.
Revolutionizing Pay Strategies: Don't Miss Our Latest Blogs on Compensation Benchmarking