
Your company invests heavily in benefits, yet most of your workforce sees only one number: the deduction on their payslip. That perception gap is a direct drain on your retention strategy. When employees cannot quantify the employer's contribution to their health plan, retirement fund, or life insurance, the investment becomes invisible. A 2026 Mutual of Omaha study confirms the gap: only 53% of employees report a strong understanding of the benefits available to them.
You are losing the ability to compete on total rewards. With 90% of U.S. employers citing benefit costs as the central issue shaping their strategy, per data cited by Forma, the pressure to extract full value from every dollar spent is immense. A generous package alone does not solve the problem. HR teams must translate employer costs into personal employee value. The most effective way to achieve this is through specialized digital tools that personalize valuation and make hidden contributions tangible.
This article maps out seven solutions that transform abstract benefit grids into clear, compelling personal value. You will see platforms that unify total rewards, integrate directly with payroll, model future wealth growth, and quantify the currency of culture.
Better brochures won't close the compensation communication gap. The right technology will. These findings shape your tool selection.
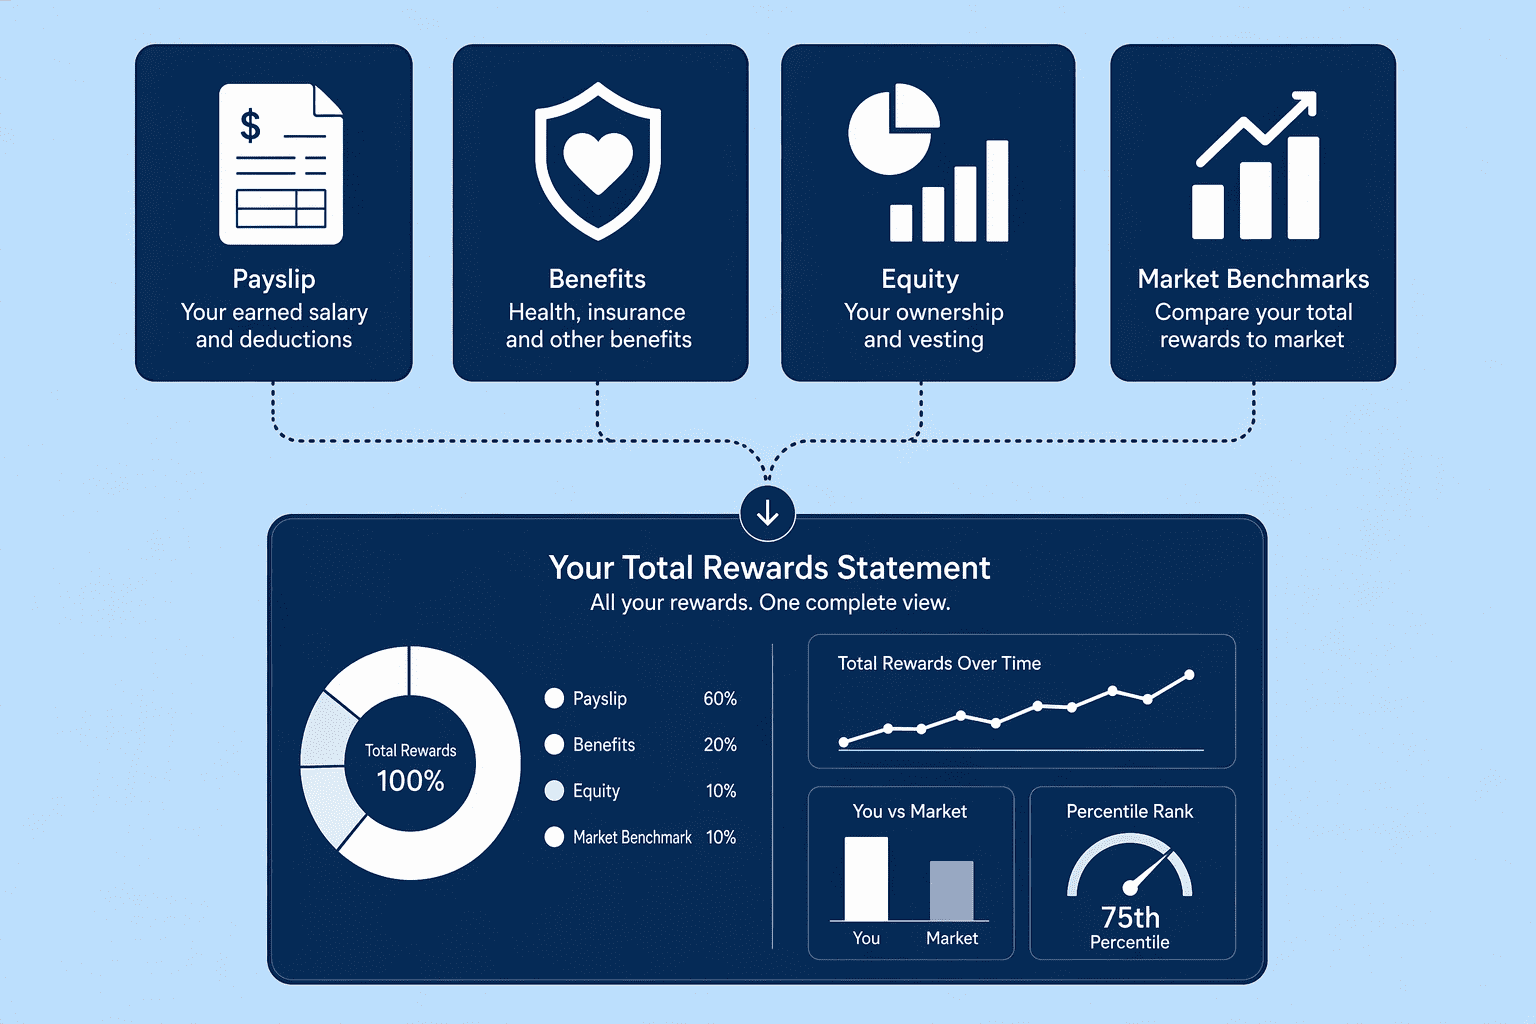
The top recommendation for transforming hidden costs into visible value is CompUp, a compensation-specialized platform that generates personalized Total Rewards Statements synced with real-time market benchmarks. Employees rarely piece together a payslip, an insurance card, and a vague stock option agreement into a single mental picture. CompUp builds that unified view and answers two questions your people ask themselves every day that drive turnover: 'What am I really paid relative to the market?' and 'What is the total value my employer puts into my package?'
The platform automates a spreadsheet nightmare. As your appraisal cycle closes, CompUp can automatically generate a branded statement that itemizes base pay, employer insurance contributions, retirement benefits, and equity, placed directly alongside industry-specific compensation benchmarks. Manual statements are static and often mismatch localized allowances with base currency. By connecting internal data with external market pay data, the platform gives each employee a receipt of their package that also shows its objective market worth.
This approach does not replace specialist HCM suites in payroll processing, but it fills the communication gap they leave open. For organizations where the reward function is distinct from HR administration, CompUp consolidates fragmented compensation activity into a single source of truth. Distribution is flexible: Self Service for employees, Manager Service so directors can view their direct reports' packages, or administrative dashboards for the comp team.
The most trusted channel for an employee remains their paycheck. ADP Workforce Now anchors total compensation understanding directly in the payroll experience, generating a real-time statement that lives where employees already repeatedly visit.
Instead of sending employees to a separate portal they might ignore, ADP mirrors employer contributions to health benefits, retirement, and tuition reimbursement in a single ledger inside the payroll interface. An employee sees the company's investment sitting next to their own deduction. That shifts the frame from 'cost to me' to 'investment in me.' Only 57% of employees fully understand what their benefits cover, according to Forma-cited data, so anchoring this information where people already look can lift comprehension.
The technical advantage is data integrity. ADP Workforce Now sources figures from the live payroll engine, so you eliminate the risk of static PDFs carrying outdated salary figures or incorrect allowances. For enterprises with frequent off-cycle adjustments or complex multi-state taxation, this real-time reflection keeps the employee value aligned with the actual payroll.
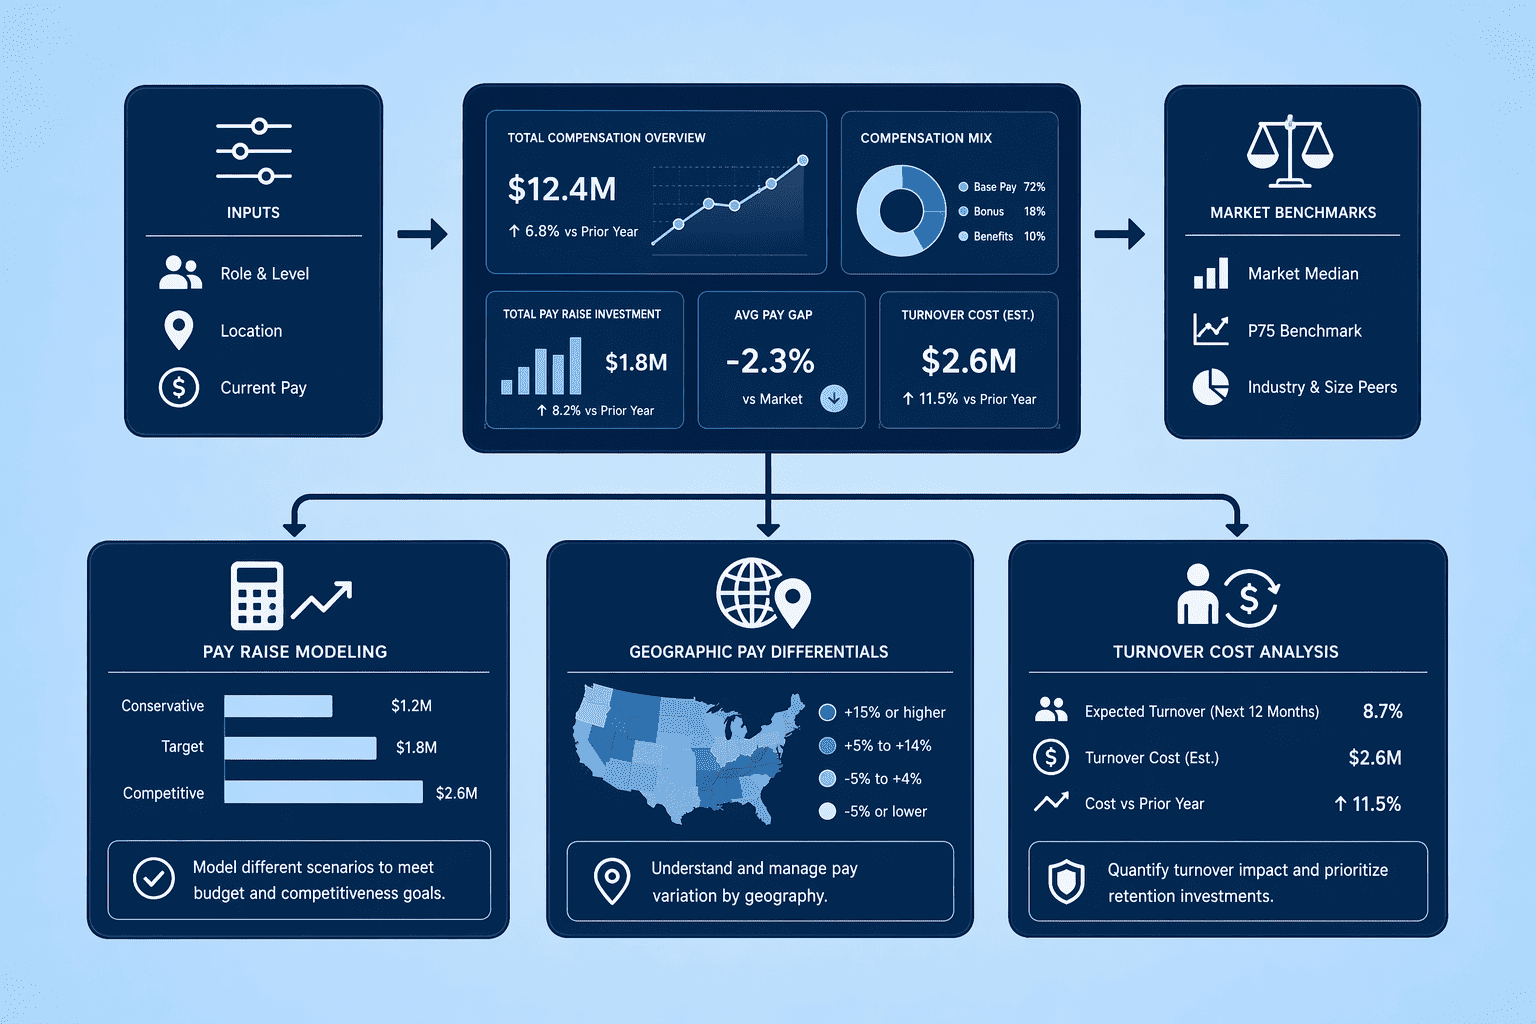
An employee who understands their future earning path and what they leave on the table by quitting negotiates differently. PayScale Insight Lab supplies the labor market context that turns internal pay decisions from gut calls into numbers. The platform models the financial impact of pay raises, tracks geographic pay differentials, and calculates your specific turnover cost against market benchmarks. Here is how its relevant modules address the awareness gap:
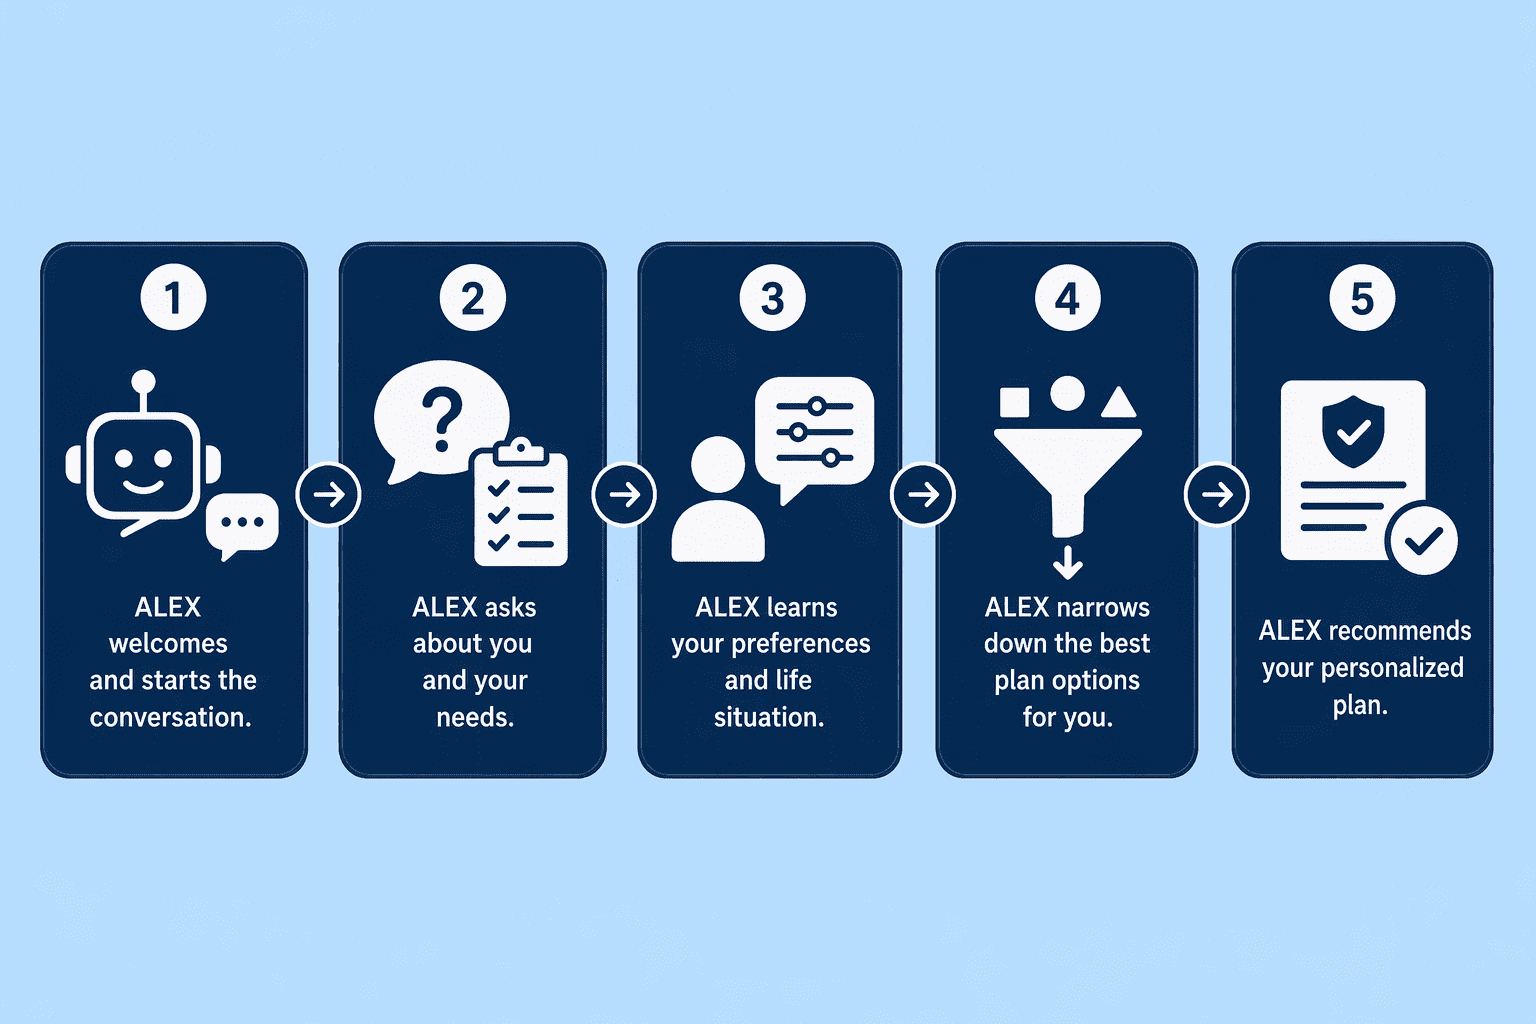
Static documents fail because they speak to the plan design, not the human life. ALEX by Jellyvision addresses the massive 81% of employees who crave a personalized bundle recommendation aligned with their life stage, family needs, and financial circumstances. This tool operates as an interactive, conversational counselor that asks specific personal questions to surface genuine coverage gaps.
Instead of overwhelming a new hire with a 40-page PDF on dental PPOs versus HMOs, ALEX asks about their specific situation: Are they planning a surgery? Do they have a teenager nearing orthodontic age? The engine then projects likely annual costs for each health plan choice based on these inputs. This predictive modeling removes the cognitive burden of guesswork and transforms open enrollment from a high-stress guessing game into a decision based on projected, personalized financial impact.
This life-stage personalization deeply impacts how employees calculate their true compensation value. An employee voluntarily ignoring a free $500 annual wellness stipend because they didn't know it applied to their gym membership means your total investment isn't landing. ALEX directly connects the benefit to the person, so the annualized value of a benefit is captured in the employee's mental calculation of their pay. The conversational UI, which avoids the dry form-filling of traditional enrollment tools, drives significantly higher engagement rates.
For HR teams, the back-end analytics deliver valuable insight into decision patterns that help refine which benefits to offer in the next plan year. Understanding why a key demographic consistently undervalues the HSA allows you to rebuild the communication around long-term wealth growth, not just a stagnant account balance, shaping benefits that employees actually perceive as valuable.
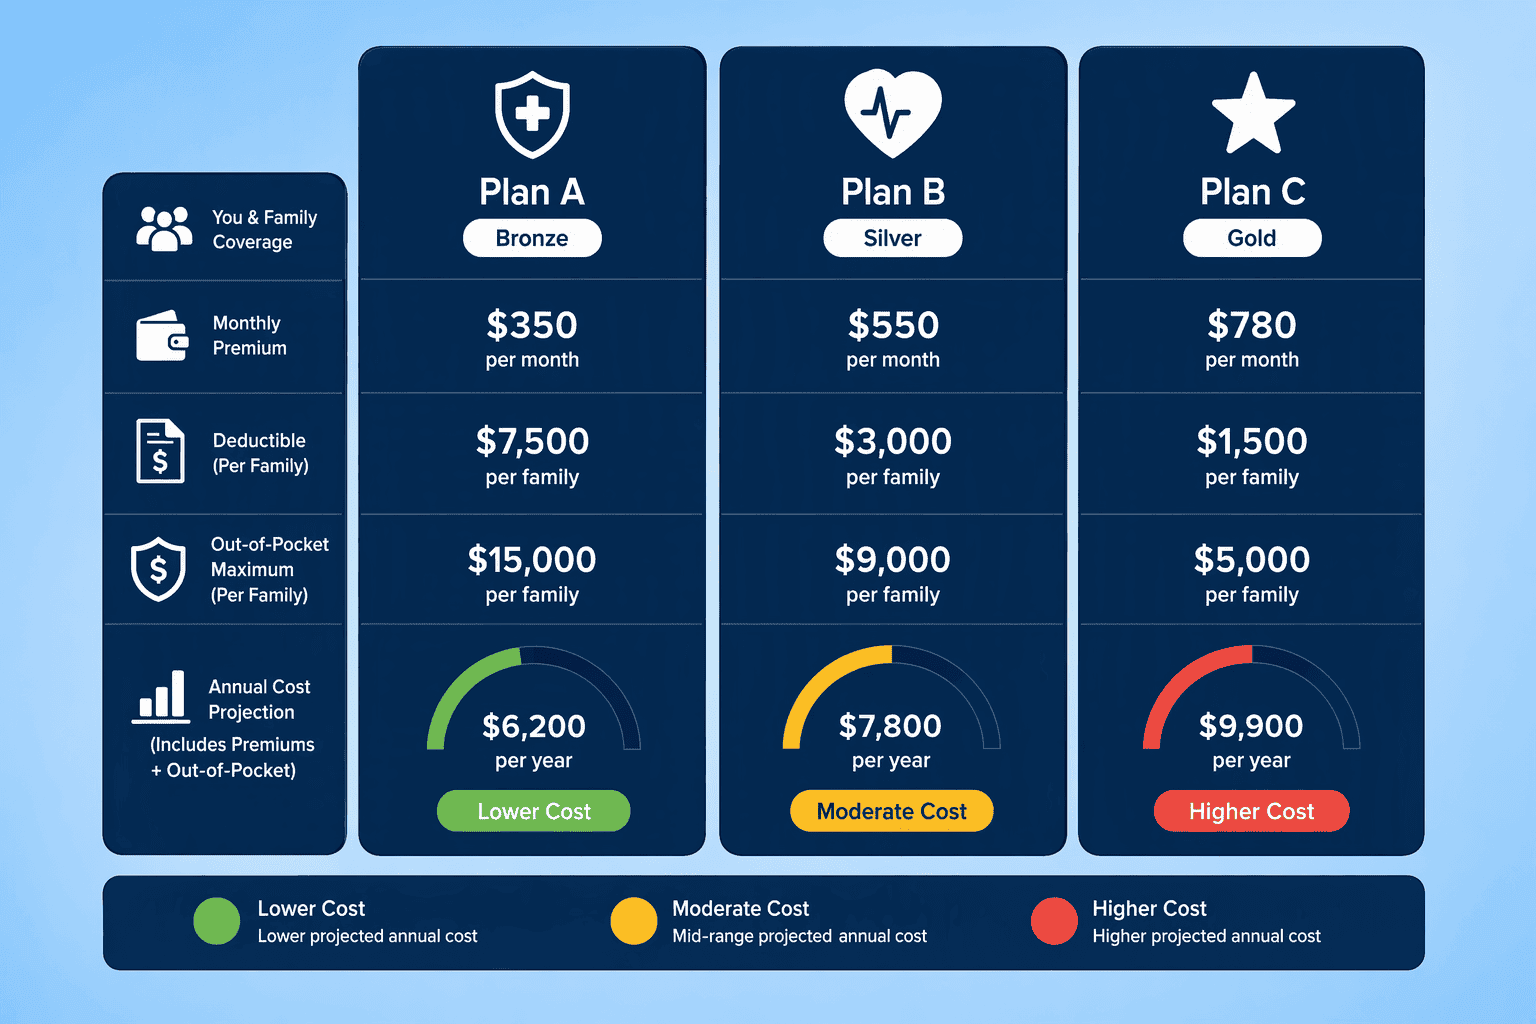
Visualizing the abstract trade-offs between premium costs, deductibles, and out-of-pocket maximums is where many employees lose the valuation thread. PlanSource reframes this complexity as a consumer-style shopping interface. Their side-by-side engine speaks directly to the 35% of employees seeking a cost-estimation calculator, per the Mutual of Omaha 2026 study, turning gray policy language into clear green, yellow, and red cost projections.
Here is how the plan comparison translates data into decision-making clarity:
| Feature | Plan A: Low-Deductible PPO Vision | Plan B: High-Deductible HDHP with HSA | Employee Interpretation |
|---|---|---|---|
| Monthly Premium | $290 (Employer Pays $210) | $140 (Employer Pays $110) | Compares immediate fixed cost versus savings potential. |
| Annual Deductible | $1,000 | $3,200 | Weighs affordability of a larger upfront health event. |
| Employer HSA Seed | $0 | $800 | Quantifies direct employer contribution adding to long-term wealth. |
| Projected Annual Cost (Moderate Use) | $3,680 | $4,480 (Offset by $1,800 in HSA build) | Projects real usage scenarios. |
By visualizing these columns, PlanSource surfaces the hidden advantage in the high-deductible plan. The employer's HSA seed contribution shifts from a passive line item into an active asset, helping the employee see they gain $800 in portable wealth annually on top of the lower salary deduction.
Many employees treat a Health Savings Account like a use-it-or-lose-it flexible spending account, a fundamental error that undervalues the entire medical plan. HealthEquity corrects this by projecting future tax-free investment growth, repositioning the HSA from a payment vehicle to a core retirement asset. An employee maxing out family contributions who leaves the funds invested in low-cost index funds for a decade is building a portfolio worth tens of thousands of dollars.
The platform also quantifies the recurring value of pre-tax commuter benefits. A $315 monthly pre-tax parking and transit allocation might feel like an administrative perk. Once HealthEquity shows the tax savings side-by-side with the gross compensation, that allocation turns into a tangible annual pay equivalent. By carving out the specific dollar value of pre-tax purchase power, the tool re-anchors these accounts as quantifiable additions to a total rewards package.
This retrospective and prospective visibility matters because 65% of employees experienced challenges during open enrollment simply because they could not project a benefit's future value, per Mutual of Omaha. Tools focused solely on today's balance miss the asset-building narrative. HealthEquity makes that growth trajectory explicit.
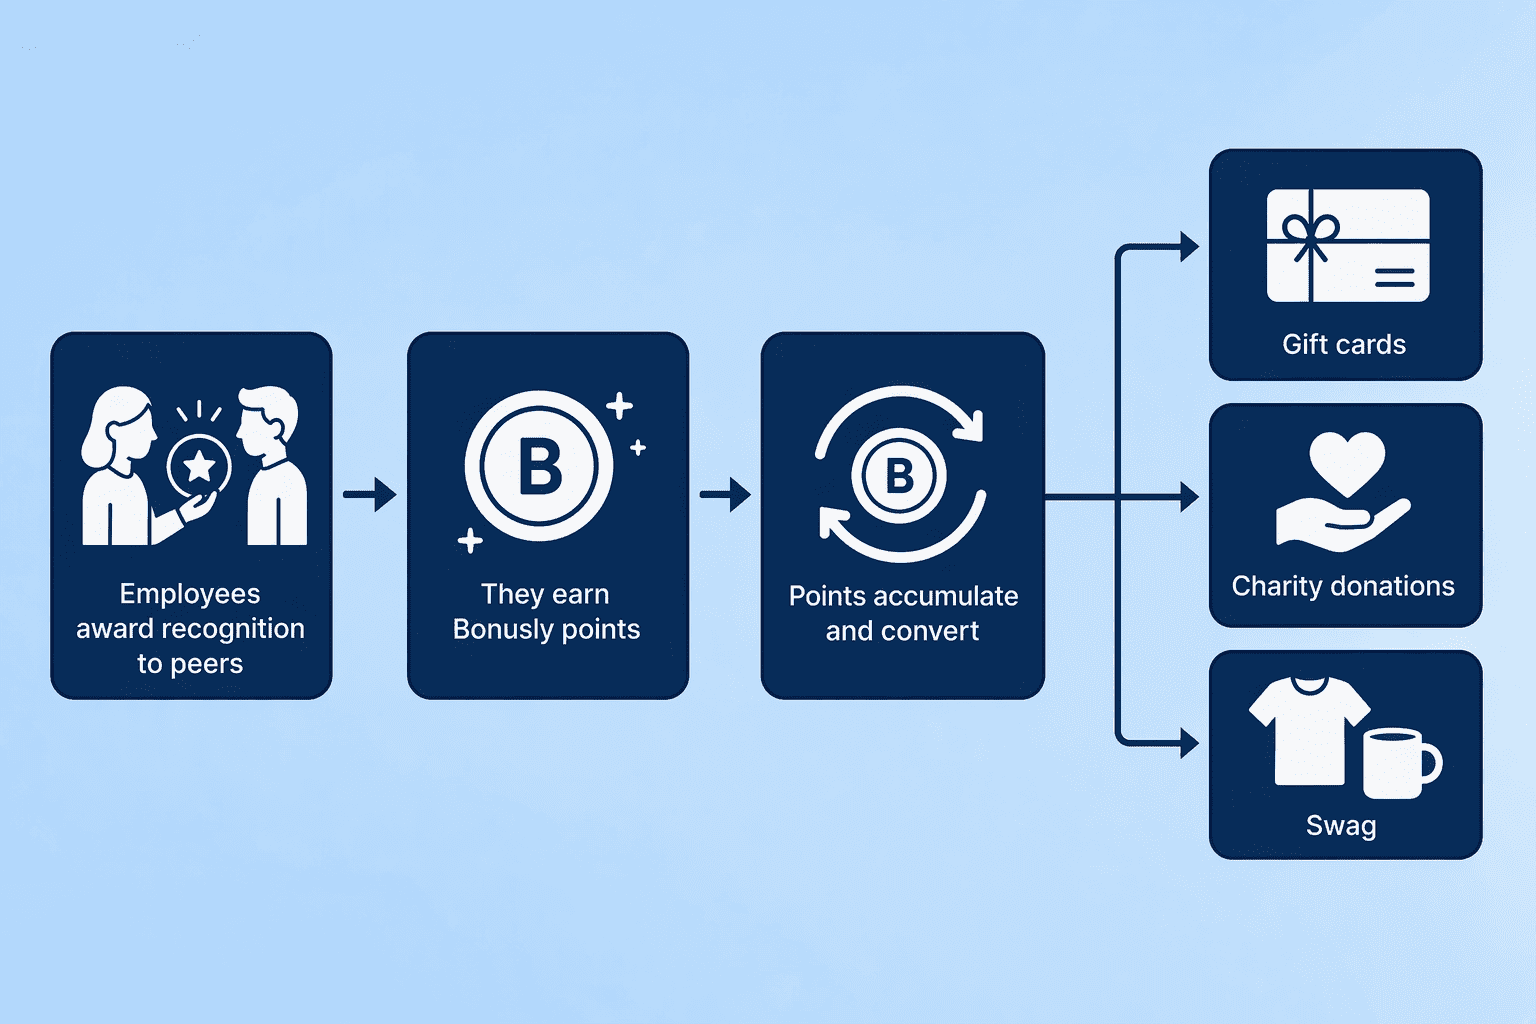
Monetizing culture has historically been a fool's errand for HR reporting. The value of an 'employee-of-the-month' parking spot or informal peer recognition is subjective until you assign it a tangible currency. Bonusly solves this by giving employees a monthly monetary allowance to award to each other in the form of peer bonuses, which can be redeemed for gift cards, charity donations, or corporate swag. This creates a trackable, visible currency around recognition that turns an abstract cultural benefit into a quantifiable reward stream.
The power here is in peer validation. Employees trust the testimony of peers over corporate messaging when evaluating a benefit's worth. When a colleague in the engineering department receives a Bonusly award specifically tagged 'for covering my on-call shift while I dealt with a family medical event,' the link between the corporate benefit (the flexible on-call culture) and its real-world value (preventing burnout during a crisis) becomes concrete and publicly celebrated.
This social proof mechanism closes a gap that pure payroll data cannot. A total rewards statement might note that your company offers unlimited PTO. A Bonusly feed shows 'John took 5 weeks of PTO last year and his manager recognized him for recharging effectively.' That distinction carries weight in perceived compensation equity, especially for younger workers who prioritize cultural autonomy in their total package valuation.
By moving non-cash culture from concept to a monetary market, Bonusly gives you hard data that recognition, autonomy, and peer support are a measurable line item with direct impact on the psychological salary your employees perceive.
The awareness gap between what you pay and what employees perceive is solvable. When you combine unified Total Rewards Statements with personalized calculators, payroll integrations, and long-term wealth projections, an opaque cost line turns into a clear, personalized asset report. The narrative shifts from a deduction on their payday to the total investment in their future. That realignment directly addresses the core retention challenge of 2026. If you're weighing options, CompUp is worth a closer look.
A total rewards statement is a personalized document listing the full monetary value of an employee's remuneration: base salary, employer-paid insurance premiums, retirement contributions, paid time off, and equity. It's critical because most employees only focus on their net pay after deductions; the statement reveals the complete financial investment an employer makes in them.
They replace abstract plan brochures with personalized cost projections. Platforms allow side-by-side comparisons of deductibles and premiums and offer life-stage recommendations, directly translating complex health plans into concrete annual dollar estimates. For instance, 35% of employees specifically want a cost-estimation calculator to visualize trade-offs between plan options.
Job offer comparison calculators help users input salary, equity, bonuses, and benefits differences to see a net package value. For current employees benchmarking their role, platforms like CompUp combine real-time market salary data with personalized Total Rewards Statements to show how a package competes with external offers.
Payroll integration ensures data accuracy and drives engagement. Tools like ADP Workforce Now embed employer contribution amounts directly onto the employee's digital payslip. Seeing the employer's investment mirror the employee's deduction in a trusted, familiar payroll environment increases comprehension and credibility.
Employers use peer recognition software like Bonusly to assign a monetary value to recognition, making cultural autonomy tangible. For wellness or commuter perks, tools project future tax savings on pre-tax purchases. The most effective approach relies on peer testimonials, as employees trust real colleague experiences over policy documents.
Modern platforms now model the future growth of equity alongside base compensation. CompUp provides a unified view of ESOP management and traditional pay, while specialized calculators like the ESOP Value Calculator Pro help employees see projected vesting values and the true cost of leaving long-term incentives unexercised.
Community Manager (Marketing)
As a Community Manager, I’m passionate about fostering collaboration and knowledge sharing among professionals in compensation management and total rewards. I develop engaging content that simplifies complex topics, empowering others to excel and aim to drive collective growth through insight and connection.
Revolutionizing Pay Strategies: Don't Miss Our Latest Blogs on Compensation Benchmarking